Forest Hills: Fire Incidents, Pennsylvania (PA)
Where are fire incidents reported in Forest Hills, PA
Something went wrong! Please refresh the page.
|
| |||||||||||||||||||||||||||||||||||||||||||||||||||||||||||||||||||||||||||||||||||||||||||||||||||||||||||||
2004 - 2018 National Fire Incident Reporting System (NFIRS) incidents
- Incident types reported to NFIRS in Forest Hills, PA
- 53653.4%Hazardous Condition
- 17016.9%Fire
- 14214.1%Good Intent Call
- 626.2%False Alarm
- 616.1%Service Call
- 232.3%Rescue & EMS
- 90.9%Severe Weather
- Fire incident types reported to NFIRS in Forest Hills, PA
- 10461.2%Structure Fires
- 2816.5%Outside Fires
- 2414.1%Mobile Property/Vehicle Fires
- 148.2%Other
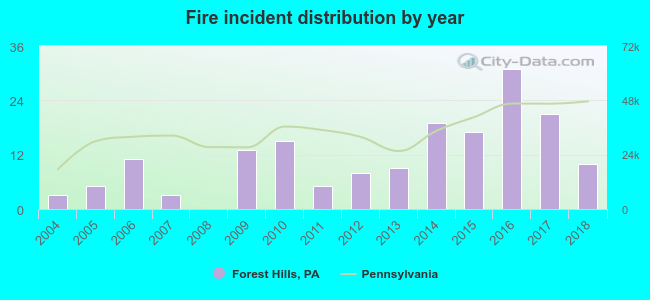 Based on the data from the years 2004 - 2018 the average number of fire incidents per year is 11. The highest number of reported fire incidents - 31 took place in 2016, and the least - 0 in 2008. The data has a rising trend.
The average number of yearly fire incidents per 10k residents in Forest Hills, PA compared to nearest cities:
(Note: Based on data for the last 3 years, including only cities with population 5,000 and above)
| Forest Hills: | 31.9 |
| Swissvale: | 58.0 |
| Turtle Creek: | 43.4 |
| Wilkinsburg: | 31.6 |
| Monroeville: | 27.7 |
| Munhall: | 46.6 |
| Duquesne: | 61.6 |
| North Versailles: | 41.8 |
| Penn Hills: | 18.7 |
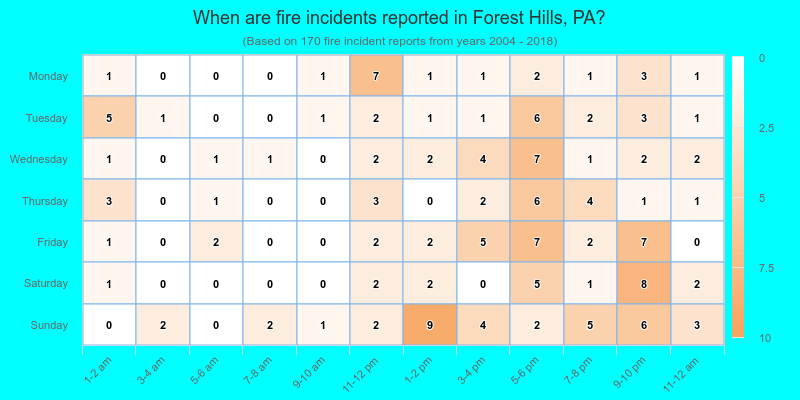
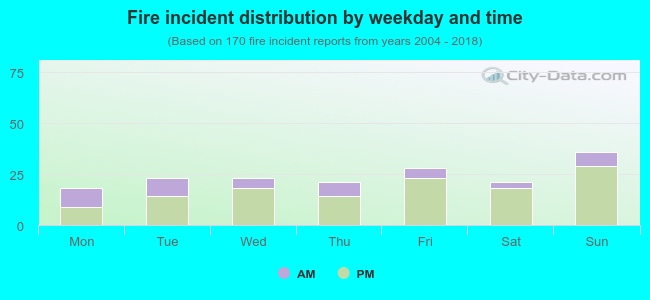 26.5% incidents where reported in the morning and 73.5% in the evening. The most fires (21.2%) took place on Sunday, and the least (10.6%) on Monday.
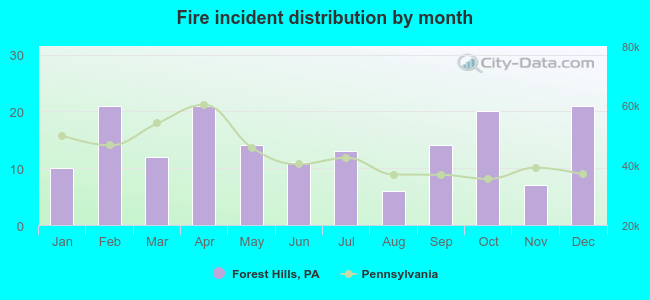 Based on the 170 reports from years 2004 - 2018 most fires (12.4%) took place during February, and the least (3.5%) in August.
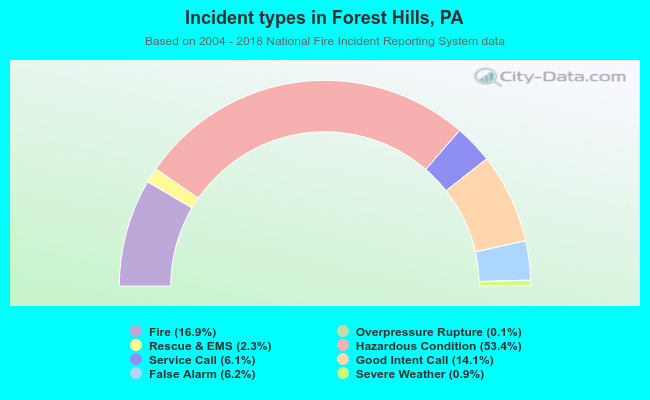 Out of all 1,004 cases reported during the years 2004 - 2018, the most belonged to the categories: Hazardous Condition (53.4%), Fire (16.9%), and Good Intent Call (14.1%).
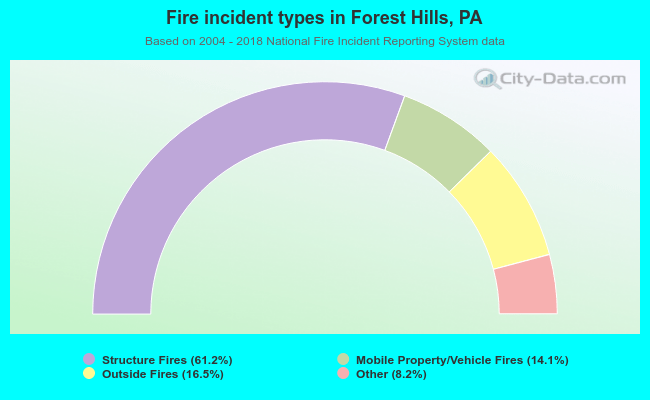 When looking into fire subcategories, the most reports belonged to: Structure Fires (61.2%), and Outside Fires (16.5%).