East Hampton: Fire Incidents, New York (NY)
Where are fire incidents reported in East Hampton, NY
Something went wrong! Please refresh the page.
|
| |||||||||||||||||||||||||||||||||||||||||||||||||||||||||||||||||||||||||||||||||||||||||||||||||||||||||||||
| Other | 55 | |||||||||||||||||||||||||||||||||||||||||||||||||||||||||||||||||||||||||||||||||||||||||||||||||||||||||||||
2002 - 2018 National Fire Incident Reporting System (NFIRS) incidents
- Incident types reported to NFIRS in East Hampton, NY
- 2,67144.3%False Alarm
- 1,27021.0%Good Intent Call
- 1,09118.1%Hazardous Condition
- 67911.3%Fire
- 2203.6%Rescue & EMS
- 981.6%Service Call
- Fire incident types reported to NFIRS in East Hampton, NY
- 42061.9%Structure Fires
- 17726.1%Outside Fires
- 649.4%Mobile Property/Vehicle Fires
- 182.7%Other
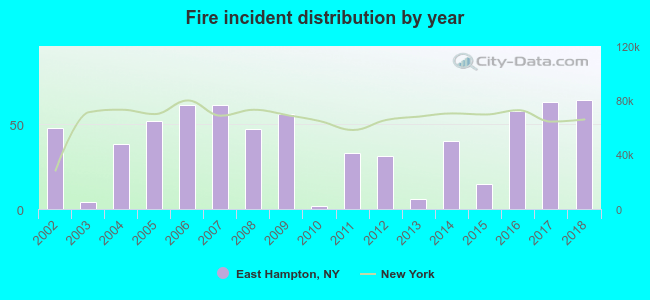 According to the data from the years 2002 - 2018 the average number of fires per year is 40. The highest number of reported fires - 64 took place in 2018, and the least - 2 in 2010. The data has a rising trend.
 The median response time based on all reported fire incidents is 6 minutes. This is higher than the New York median value.
The median response time in East Hampton, NY compared to nearest cities:
(Note: Based on data for all years, including only cities with at least 500 fire incidents)
| East Hampton: | 6 minutes |
| Southampton: | 4 minutes |
| Old Saybrook: | 4 minutes |
| East Lyme: | 6 minutes |
| Groton: | 4 minutes |
| New London: | 4 minutes |
| Waterford: | 6 minutes |
| Clinton: | 6 minutes |
| Mystic: | 5 minutes |
 32.0% incidents where reported in the morning and 68.0% in the evening. The most fires (16.9%) took place on Saturday, and the least (11.2%) on Tuesday.
 Based on the 679 fire incidents from years 2002 - 2018 most fires (11.0%) took place during January, and the least (6.6%) in April.
 Out of all 6,034 cases reported during the years 2002 - 2018, the most belonged to the categories: False Alarm (44.3%), Good Intent Call (21.0%), and Hazardous Condition (18.1%).
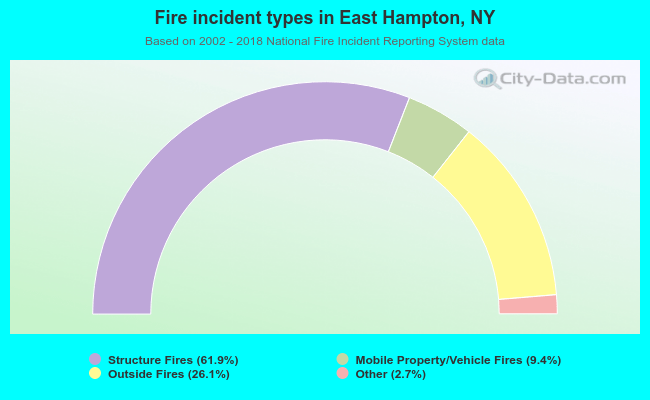 When looking into fire subcategories, the most incidents belonged to: Structure Fires (61.9%), and Outside Fires (26.1%).