East Liverpool: Fire Incidents, Ohio (OH)
Where are fire incidents reported in East Liverpool, OH
Something went wrong! Please refresh the page.
| Fire incidents reported | |
|---|---|
| Sreet name | Count |
| DRESDEN AVE | 158 |
| PENNSYLVANIA AVE | 140 |
| ST. GEORGE ST | 98 |
| STATE ROUTE 170 | 96 |
| LISBON ST | 92 |
| ST. CLAIR AVE | 84 |
| 6TH ST | 76 |
| BRADSHAW AVE | 70 |
| SPRUCEVALE RD | 64 |
| 8TH ST | 62 |
| 4TH ST | 60 |
| ECHO DELL RD | 60 |
| OHIO AVE | 60 |
| SAINT CLAIR AVE | 52 |
| AVONDALE ST | 50 |
| CALCUTTA SMITHFERRY RD | 50 |
| THOMPSON AVE | 50 |
| ANNESLEY RD | 48 |
| GRIMMS BRIDGE RD | 48 |
| SHADYSIDE AVE | 46 |
| WILBERT AVE | 46 |
| ANDERSON BLVD | 44 |
| HARVEY AVE | 44 |
| 5TH ST | 42 |
| MICHIGAN AVE | 40 |
| TRENTVALE ST | 40 |
| CADMUS ST | 38 |
| MAINE BLVD | 38 |
| LINCOLN AVE | 36 |
| SHADY LANE DR | 36 |
| Other | 1,073 |
2002 - 2018 National Fire Incident Reporting System (NFIRS) incidents
- Incident types reported to NFIRS in East Liverpool, OH
- 2,94128.2%Fire
- 2,55124.4%Service Call
- 2,24721.5%Hazardous Condition
- 1,29312.4%Rescue & EMS
- 6015.8%Good Intent Call
- 5965.7%False Alarm
- 1041.0%Severe Weather
- 950.9%Special Incident
- 130.1%Overpressure Rupture
- Fire incident types reported to NFIRS in East Liverpool, OH
- 1,37246.7%Structure Fires
- 91931.2%Outside Fires
- 62821.4%Mobile Property/Vehicle Fires
- 220.7%Other
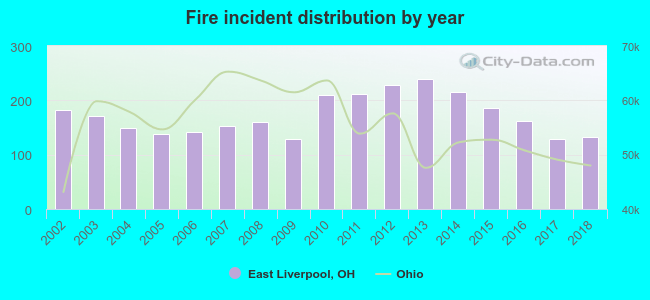 Based on the data from the years 2002 - 2018 the average number of fire incidents per year is 173. The highest number of reported fires - 240 took place in 2013, and the least - 129 in 2009. The data has a declining trend.
The average number of yearly fire incidents per 10k residents in East Liverpool, OH compared to nearest cities:
(Note: Based on data for the last 3 years, including only cities with population 5,000 and above)
| East Liverpool: | 128.8 |
| Steubenville: | 62.6 |
| Columbiana: | 40.0 |
 The median response time based on all reported fire incidents is 5 minutes. This is lower compared to the state median value.
The median response time in East Liverpool, OH compared to nearest cities:
(Note: Based on data for all years, including only cities with at least 500 fire incidents)
| East Liverpool: | 5 minutes |
| Wellsville: | 6 minutes |
| Toronto: | 8 minutes |
| Salineville: | 10 minutes |
| East Palestine: | 7 minutes |
| Lisbon: | 10 minutes |
| Steubenville: | 3 minutes |
 Based on the reports from the years 2002 - 2018 the average number of fire-related yearly deaths is 1. The highest number of deaths - 4 took place in 2012, and the lowest - 0 in 2002. The data has an increasing trend.
The average number of deaths per 1,000 fires is 4. This indicator was the highest - 22 in 2015, and the lowest 0 in 2002. The trend for fatalities per 1,000 fire incidents is growing. Compared to the state value the number of fatalities per 1,000 incidents is much higher.
Based on the reports from the years 2002 - 2018 the average number of fire-related yearly deaths is 1. The highest number of deaths - 4 took place in 2012, and the lowest - 0 in 2002. The data has an increasing trend.
The average number of deaths per 1,000 fires is 4. This indicator was the highest - 22 in 2015, and the lowest 0 in 2002. The trend for fatalities per 1,000 fire incidents is growing. Compared to the state value the number of fatalities per 1,000 incidents is much higher.Deaths per 1,000 incidents in East Liverpool, OH compared to nearest cities:
(Note: Based on data for all years, including only cities with at least 2,500 fire incidents)
| East Liverpool: | 4.8 |
 Based on the data from the years 2002 - 2018 the average number of fire-related casualties per year is 1. The highest number of casualties - 6 took place in 2002, and the lowest - 0 in 2006. The data has a decreasing trend.
The average number of injuries per 1,000 fires is 8. This indicator was the highest - 33 in 2002, and the lowest 0 in 2006. The trend for injuries per 1,000 fires is decreasing. Compared to the state value the number of injuries per 1,000 fire incidents is lower.
Based on the data from the years 2002 - 2018 the average number of fire-related casualties per year is 1. The highest number of casualties - 6 took place in 2002, and the lowest - 0 in 2006. The data has a decreasing trend.
The average number of injuries per 1,000 fires is 8. This indicator was the highest - 33 in 2002, and the lowest 0 in 2006. The trend for injuries per 1,000 fires is decreasing. Compared to the state value the number of injuries per 1,000 fire incidents is lower.Casualties per 1,000 incidents in East Liverpool, OH compared to nearest cities:
(Note: Based on data for all years, including only cities with at least 500 fire incidents)
| East Liverpool: | 8.2 |
| Wellsville: | 10.0 |
| Toronto: | 11.2 |
| Salineville: | 7.4 |
| East Palestine: | 18.3 |
| Lisbon: | 5.6 |
| Steubenville: | 16.9 |
 29.7% incidents where reported in the morning and 70.3% in the evening. The most fires (15.9%) took place on Saturday, and the least (13.1%) on Wednesday.
 Based on the 2,941 fire incident reports from years 2002 - 2018 most fires (12.1%) took place during April, and the least (6.0%) in February.
 Out of all 10,441 cases reported during the years 2002 - 2018, the most belonged to the categories: Fire (28.2%), Service Call (24.4%), and Hazardous Condition (21.5%).
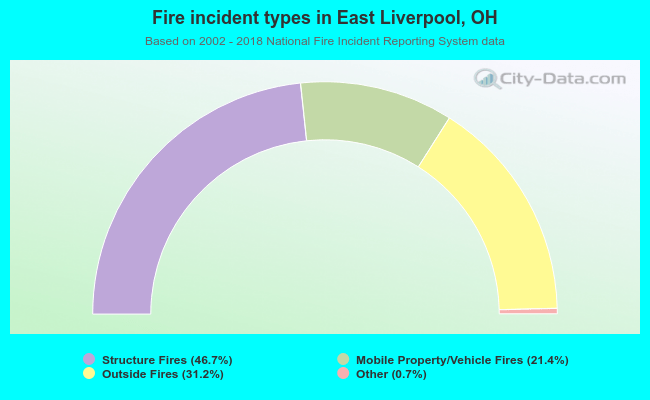 When looking into fire subcategories, the most incidents belonged to: Structure Fires (46.7%), and Outside Fires (31.2%).