Steubenville: Fire Incidents, Ohio (OH)
Where are fire incidents reported in Steubenville, OH
Something went wrong! Please refresh the page.
| Fire incidents reported | |
|---|---|
| Sreet name | Count |
| SUNSET BLVD | 224 |
| 4TH ST | 182 |
| 5TH ST | 110 |
| 6TH ST | 108 |
| 7TH ST | 102 |
| MARKET ST | 102 |
| MALL DR | 88 |
| LINCOLN AVE | 84 |
| PENNSYLVANIA AVE | 78 |
| 3RD ST | 70 |
| S.R. 213 | 66 |
| STATE ROUTE 213 | 60 |
| WELLESLEY AVE | 58 |
| CR 56 | 56 |
| OAKGROVE AVE | 50 |
| SUMMIT AVE | 50 |
| OREGON AVE | 46 |
| UNIVERSITY BLVD | 44 |
| 8TH ST | 38 |
| JOHNSON RD | 36 |
| ADAMS ST | 34 |
| EUCLID AVE | 34 |
| ROSSWELL AVE | 34 |
| HOLLYWOOD BLVD | 32 |
| BRADY AVE | 30 |
| JOHN SCOTT HWY | 30 |
| SINCLAIR AVE | 30 |
| C.R. 43 | 28 |
| RIDGE AVE | 28 |
| LAWSON AVE | 26 |
| Other | 233 |
2002 - 2018 National Fire Incident Reporting System (NFIRS) incidents
- Incident types reported to NFIRS in Steubenville, OH
- 2,19123.8%Fire
- 1,98521.5%Rescue & EMS
- 1,71718.6%Hazardous Condition
- 1,70918.5%Service Call
- 1,00510.9%False Alarm
- 5626.1%Good Intent Call
- 340.4%Overpressure Rupture
- 110.1%Special Incident
- Fire incident types reported to NFIRS in Steubenville, OH
- 1,12451.3%Structure Fires
- 62928.7%Outside Fires
- 42719.5%Mobile Property/Vehicle Fires
- 110.5%Other
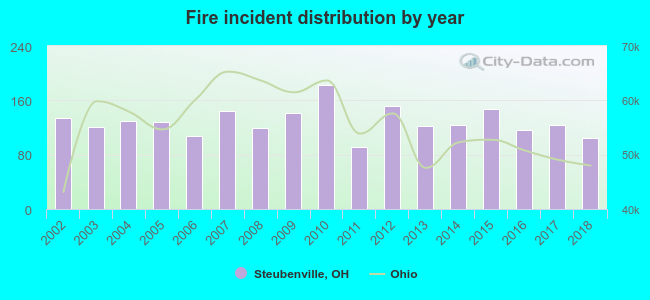 According to the data from the years 2002 - 2018 the average number of fire incidents per year is 129. The highest number of reported fire incidents - 183 took place in 2010, and the least - 92 in 2011. The data has a decreasing trend.
The average number of yearly fire incidents per 10k residents in Steubenville, OH compared to nearest cities:
(Note: Based on data for the last 3 years, including only cities with population 5,000 and above)
| Steubenville: | 62.6 |
| East Liverpool: | 128.8 |
| Martins Ferry: | 44.5 |
 The median response time based on all reported fire incidents is 3 minutes. This is much lower than the state median value.
The median response time in Steubenville, OH compared to nearest cities:
(Note: Based on data for all years, including only cities with at least 500 fire incidents)
| Steubenville: | 3 minutes |
| Mingo Junction: | 6 minutes |
| Toronto: | 8 minutes |
| Wellsville: | 6 minutes |
| East Liverpool: | 5 minutes |
| Martins Ferry: | 7 minutes |
| Cadiz: | 10 minutes |
| Salineville: | 10 minutes |
| Bridgeport: | 8 minutes |
 Based on the data from the years 2002 - 2018 the average number of fire-related fatalities per year is 1. The highest number of reported deaths - 5 took place in 2015, and the lowest - 0 in 2002. The data has a constant trend.
 Based on the reports from the years 2002 - 2018 the average number of fire-related yearly casualties is 2. The highest number of injuries - 10 took place in 2015, and the lowest - 0 in 2005. The data has a decreasing trend.
The average number of casualties per 1,000 fire incidents is 16. This indicator was the highest - 68 in 2015, and the lowest 0 in 2005. The trend for casualties per 1,000 incidents is declining. Compared to the Ohio value the number of casualties per 1,000 fires is about the same.
Based on the reports from the years 2002 - 2018 the average number of fire-related yearly casualties is 2. The highest number of injuries - 10 took place in 2015, and the lowest - 0 in 2005. The data has a decreasing trend.
The average number of casualties per 1,000 fire incidents is 16. This indicator was the highest - 68 in 2015, and the lowest 0 in 2005. The trend for casualties per 1,000 incidents is declining. Compared to the Ohio value the number of casualties per 1,000 fires is about the same.Casualties per 1,000 incidents in Steubenville, OH compared to nearest cities:
(Note: Based on data for all years, including only cities with at least 500 fire incidents)
| Steubenville: | 16.9 |
| Mingo Junction: | 40.9 |
| Toronto: | 11.2 |
| Wellsville: | 10.0 |
| East Liverpool: | 8.2 |
| Martins Ferry: | 9.9 |
| Cadiz: | 10.6 |
| Salineville: | 7.4 |
| Bridgeport: | 9.5 |
 33.9% incidents where reported in the morning and 66.1% in the evening. The most fires (15.9%) took place on Saturday, and the least (12.6%) on Friday.
 According to the 2,191 fire incidents from years 2002 - 2018 most fires (11.5%) took place during April, and the least (5.8%) in November.
 Out of all 9,220 cases reported during the years 2002 - 2018, the most belonged to the categories: Fire (23.8%), Rescue & EMS (21.5%), and Hazardous Condition (18.6%).
 When looking into fire subcategories, the most reports belonged to: Structure Fires (51.3%), and Outside Fires (28.7%).