Easton: Fire Incidents, Connecticut (CT)
Where are fire incidents reported in Easton, CT
Something went wrong! Please refresh the page.
|
| |||||||||||||||||||||||||||||||||||||||||||||||||||||||||||||||||||||||||||||||||||||||||||||||||||||||||||||
2002 - 2018 National Fire Incident Reporting System (NFIRS) incidents
- Incident types reported to NFIRS in Easton, CT
- 1,38234.3%Hazardous Condition
- 76919.1%Rescue & EMS
- 62315.4%False Alarm
- 61015.1%Service Call
- 3819.4%Fire
- 2566.3%Good Intent Call
- 70.2%Severe Weather
- Fire incident types reported to NFIRS in Easton, CT
- 16844.1%Structure Fires
- 13635.7%Outside Fires
- 4511.8%Mobile Property/Vehicle Fires
- 328.4%Other
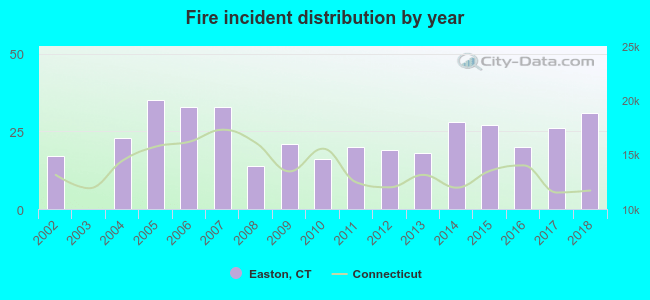 According to the data from the years 2002 - 2018 the average number of fire incidents per year is 22. The highest number of fires - 35 took place in 2005, and the least - 0 in 2003. The data has a growing trend.
The average number of yearly fire incidents per 10k residents in Easton, CT compared to nearest cities:
(Note: Based on data for the last 3 years, including only cities with population 5,000 and above)
| Easton: | 34.3 |
| Trumbull: | 36.1 |
| Weston: | 20.6 |
| Fairfield: | 22.6 |
| Redding: | 19.3 |
| Bridgeport: | 30.2 |
| Monroe: | 45.5 |
| Wilton: | 24.5 |
| Westport: | 32.1 |

 29.4% incidents where reported in the morning and 70.6% in the evening. The most fires (19.4%) took place on Saturday, and the least (11.5%) on Thursday.
 According to the 381 fire incident reports from years 2002 - 2018 most fires (13.1%) took place during January, and the least (5.5%) in December.
 Out of all 4,034 cases reported during the years 2002 - 2018, the most belonged to the categories: Hazardous Condition (34.3%), Rescue & EMS (19.1%), and False Alarm (15.4%).
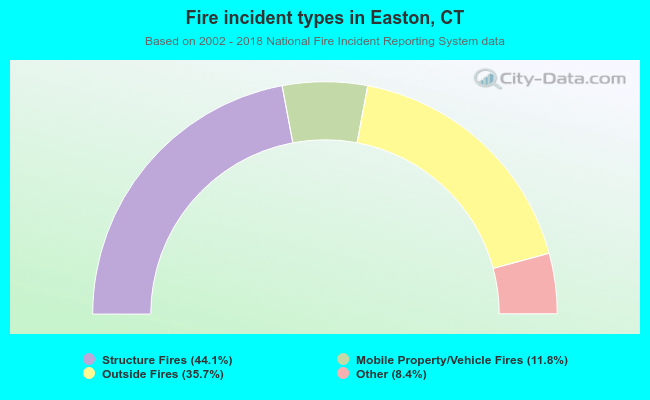 When looking into fire subcategories, the most incidents belonged to: Structure Fires (44.1%), and Outside Fires (35.7%).