Monroe: Fire Incidents, Connecticut (CT)
Where are fire incidents reported in Monroe, CT
Something went wrong! Please refresh the page.
| Fire incidents reported | |
|---|---|
| Sreet name | Count |
| MONROE TPKE | 224 |
| MAIN ST | 178 |
| ELM ST | 76 |
| FAN HILL RD | 66 |
| PEPPER ST | 42 |
| PURDY HILL RD | 42 |
| WHEELER RD | 42 |
| CUTLERS FARM RD | 38 |
| SHELTON RD | 38 |
| TURKEY ROOST RD | 38 |
| CROSS HILL RD | 32 |
| WEBB CIR | 32 |
| MOOSE HILL RD | 28 |
| OLD ZOAR RD | 24 |
| FLINT RIDGE RD | 22 |
| HATTERTOWN RD | 18 |
| HIDDEN KNOLLS CIR | 18 |
| KNORR RD | 18 |
| MONROE TPKE | 18 |
| BARN HILL RD | 16 |
| GUINEA RD | 16 |
| DOWNS RD | 14 |
| GARDER RD | 14 |
| JOCKEY HOLLOW RD | 14 |
| SUNRISE TER | 14 |
| CAMELOT DR | 12 |
| CHURCH ST | 12 |
| LONGVIEW RD | 12 |
| MEADOWS END RD | 12 |
| PASTORS WALK | 12 |
2002 - 2018 National Fire Incident Reporting System (NFIRS) incidents
- Incident types reported to NFIRS in Monroe, CT
- 2,70436.0%Hazardous Condition
- 1,69222.5%False Alarm
- 1,12214.9%Fire
- 96912.9%Good Intent Call
- 6799.0%Service Call
- 3364.5%Rescue & EMS
- 90.1%Severe Weather
- 80.1%Overpressure Rupture
- Fire incident types reported to NFIRS in Monroe, CT
- 47742.5%Structure Fires
- 33329.7%Outside Fires
- 16514.7%Other
- 14713.1%Mobile Property/Vehicle Fires
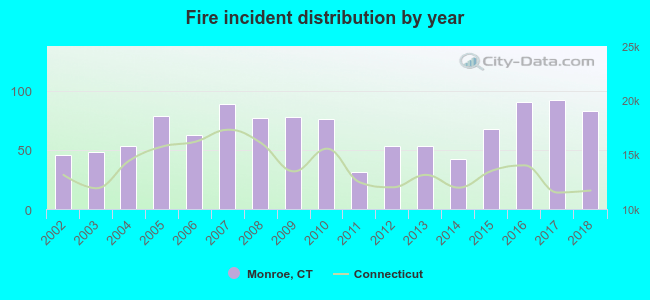 Based on the data from the years 2002 - 2018 the average number of fire incidents per year is 66. The highest number of reported fires - 92 took place in 2017, and the least - 31 in 2011. The data has an increasing trend.
The average number of yearly fire incidents per 10k residents in Monroe, CT compared to nearest cities:
(Note: Based on data for the last 3 years, including only cities with population 5,000 and above)
| Monroe: | 45.5 |
| Riverside: | 18.6 |
| Shelton: | 16.1 |
| Trumbull: | 36.1 |
| Easton: | 34.3 |
| Derby: | 47.0 |
| Ansonia: | 49.2 |
| Oxford: | 26.3 |
| Seymour: | 29.4 |
 The median response time based on all reported fire incidents is 6 minutes. This is comparable to the Connecticut median value.
The median response time in Monroe, CT compared to nearest cities:
(Note: Based on data for all years, including only cities with at least 500 fire incidents)
| Monroe: | 6 minutes |
| Shelton: | 7 minutes |
| Trumbull: | 6 minutes |
| Newtown: | 7 minutes |
| Derby: | 3 minutes |
| Ansonia: | 4 minutes |
| Oxford: | 6 minutes |
| Seymour: | 5 minutes |
| Redding: | 7 minutes |
 According to the data from the years 2002 - 2018 the average number of fire-related casualties per year is 0. The highest number of casualties - 2 took place in 2002, and the lowest - 0 in 2003. The data has a declining trend.
The average number of injuries per 1,000 fires is 4. This indicator was the highest - 43 in 2002, and the lowest 0 in 2003. The trend for casualties per 1,000 fire incidents is declining. Compared to the Connecticut value the number of injuries per 1,000 incidents is much lower.
According to the data from the years 2002 - 2018 the average number of fire-related casualties per year is 0. The highest number of casualties - 2 took place in 2002, and the lowest - 0 in 2003. The data has a declining trend.
The average number of injuries per 1,000 fires is 4. This indicator was the highest - 43 in 2002, and the lowest 0 in 2003. The trend for casualties per 1,000 fire incidents is declining. Compared to the Connecticut value the number of injuries per 1,000 incidents is much lower.
 30.3% incidents where reported in the morning and 69.7% in the evening. The most fires (18.3%) took place on Tuesday, and the least (11.3%) on Sunday.
 Based on the 1,122 fires from years 2002 - 2018 most fires (11.3%) took place during April, and the least (4.4%) in September.
 Out of all 7,520 cases reported during the years 2002 - 2018, the most belonged to the categories: Hazardous Condition (36.0%), False Alarm (22.5%), and Fire (14.9%).
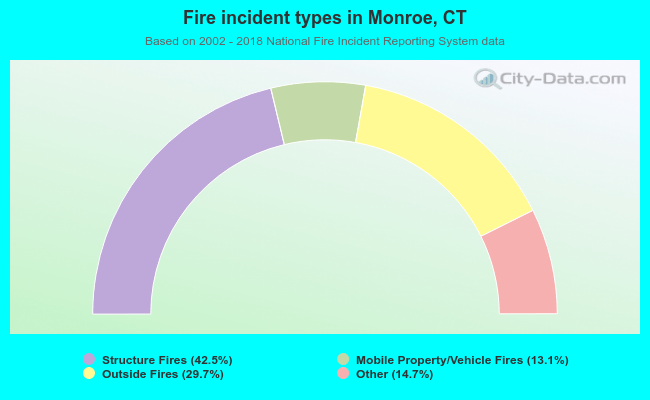 When looking into fire subcategories, the most incidents belonged to: Structure Fires (42.5%), and Outside Fires (29.7%).