Ellicott City: Fire Incidents, Maryland (MD)
Where are fire incidents reported in Ellicott City, MD
Something went wrong! Please refresh the page.
| Fire incidents reported | |
|---|---|
| Sreet name | Count |
| BALTIMORE NATIONAL PK | 232 |
| TOWN AND COUNTRY BLVD | 192 |
| MONTGOMERY RD | 150 |
| DORSEY HALL DR | 78 |
| FREDERICK RD | 66 |
| MAIN ST | 60 |
| OLD FREDERICK RD | 60 |
| BALTIMORE NATIONAL P -- | 56 |
| WEST SPRINGS DR | 54 |
| NORMANDY WOODS DR | 52 |
| CENTENNIAL LN | 48 |
| BALTIMORE NATIONAL | 46 |
| NORTH CHATHAM RD | 46 |
| WHEATON WAY | 46 |
| COLLEGE AVE | 44 |
| MONTGOMERY RUN RD | 44 |
| NORTH RIDGE RD | 42 |
| SAINT JOHNS LN | 38 |
| WATERLOO RD | 38 |
| SONIA TRL | 36 |
| TRIADELPHIA RD | 34 |
| CLARKSVILLE PK | 32 |
| MOUNT IDA DR | 32 |
| CORPORATE CT | 30 |
| FOLLY QUARTER RD | 30 |
| PLUMTREE DR | 30 |
| BALTIMORE NATIONAL P | 28 |
| FALLS RUN RD | 28 |
| OLD FREDERICK RD -- | 28 |
| DANIELS RD | 26 |
| Other | 597 |
2002 - 2018 National Fire Incident Reporting System (NFIRS) incidents
- Incident types reported to NFIRS in Ellicott City, MD
- 29,86567.9%Rescue & EMS
- 3,8978.9%Good Intent Call
- 3,7388.5%Hazardous Condition
- 2,3915.4%False Alarm
- 2,3235.3%Fire
- 1,6403.7%Service Call
- 640.1%Severe Weather
- Fire incident types reported to NFIRS in Ellicott City, MD
- 98842.5%Outside Fires
- 92539.8%Structure Fires
- 37916.3%Mobile Property/Vehicle Fires
- 311.3%Other
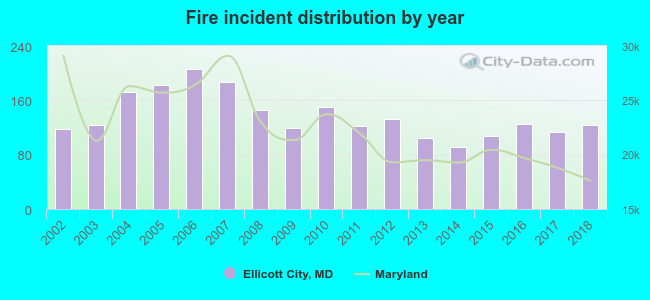 Based on the data from the years 2002 - 2018 the average number of fires per year is 137. The highest number of reported fires - 206 took place in 2006, and the least - 91 in 2014. The data has a rising trend.
The average number of yearly fire incidents per 10k residents in Ellicott City, MD compared to nearest cities:
(Note: Based on data for the last 3 years, including only cities with population 5,000 and above)
| Ellicott City: | 18.3 |
| Columbia: | 18.9 |
| Catonsville: | 21.1 |
| Elkridge: | 60.5 |
| Arbutus: | 19.4 |
| Randallstown: | 23.4 |
| Savage: | 11.8 |
| Lansdowne: | 2.4 |
| Scaggsville: | 0.4 |
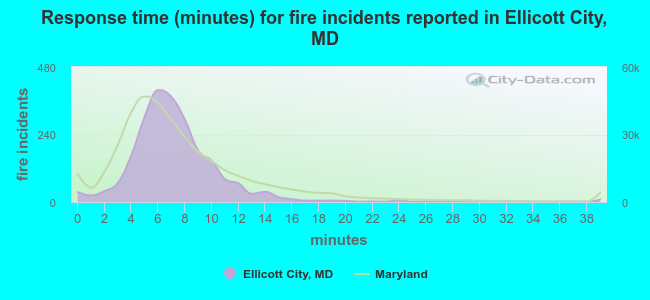 The median response time based on all reported fire incidents is 7 minutes. This is about the same as the Maryland median value.
The median response time in Ellicott City, MD compared to nearest cities:
(Note: Based on data for all years, including only cities with at least 500 fire incidents)
| Ellicott City: | 7 minutes |
| Columbia: | 6 minutes |
| Catonsville: | 5 minutes |
| Elkridge: | 7 minutes |
| Arbutus: | 5 minutes |
| Randallstown: | 5 minutes |
| Jessup: | 7 minutes |
| Owings Mills: | 6 minutes |
| Pikesville: | 5 minutes |
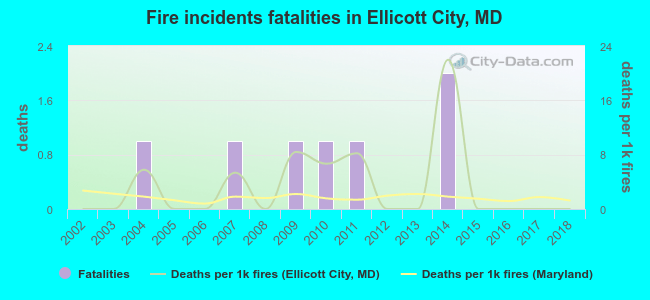 According to the data from the years 2002 - 2018 the average number of fire-related fatalities per year is 0. The highest number of deaths - 2 took place in 2014, and the lowest - 0 in 2002. The data has a constant trend.
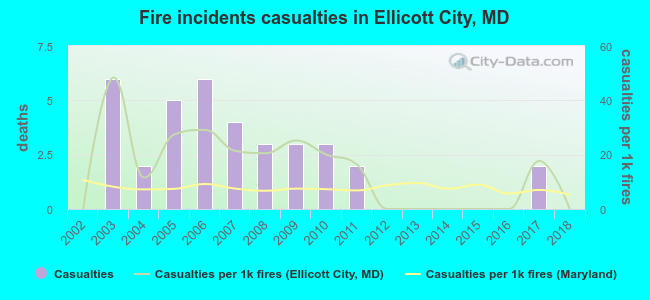 According to the data from the years 2002 - 2018 the average number of fire-related casualties per year is 2. The highest number of injuries - 6 took place in 2003, and the lowest - 0 in 2002. The data has a constant trend.
The average number of injuries per 1,000 fires is 14. This indicator was the highest - 48 in 2003, and the lowest 0 in 2002. The trend for casualties per 1,000 incidents is constant. Compared to the state value the number of casualties per 1,000 fire incidents is higher.
According to the data from the years 2002 - 2018 the average number of fire-related casualties per year is 2. The highest number of injuries - 6 took place in 2003, and the lowest - 0 in 2002. The data has a constant trend.
The average number of injuries per 1,000 fires is 14. This indicator was the highest - 48 in 2003, and the lowest 0 in 2002. The trend for casualties per 1,000 incidents is constant. Compared to the state value the number of casualties per 1,000 fire incidents is higher.Casualties per 1,000 incidents in Ellicott City, MD compared to nearest cities:
(Note: Based on data for all years, including only cities with at least 500 fire incidents)
| Ellicott City: | 15.5 |
| Columbia: | 18.9 |
| Catonsville: | 3.5 |
| Elkridge: | 10.2 |
| Arbutus: | 1.5 |
| Randallstown: | 7.7 |
| Jessup: | 8.5 |
| Owings Mills: | 4.6 |
| Pikesville: | 4.2 |
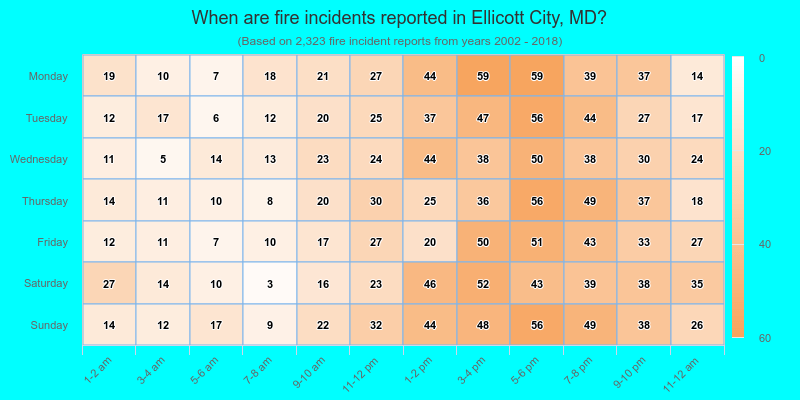
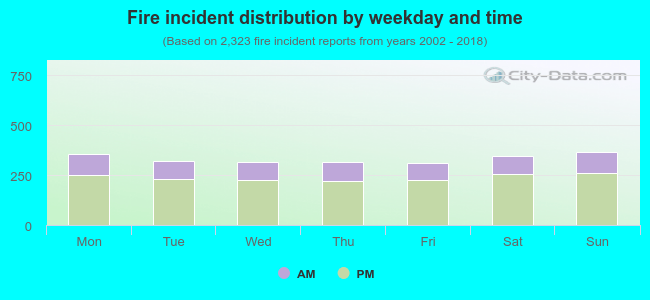 28.4% incidents where reported in the morning and 71.6% in the evening. The most fires (15.8%) took place on Sunday, and the least (13.3%) on Friday.
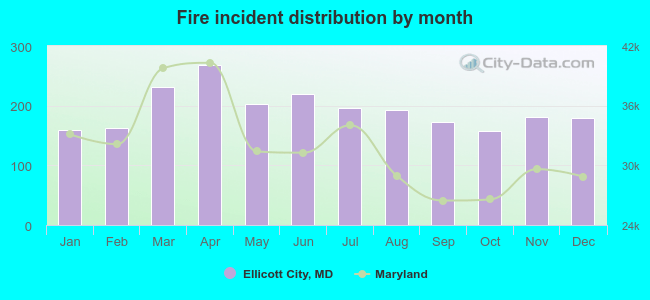 Based on the 2,323 fires from years 2002 - 2018 most fires (11.5%) took place during April, and the least (6.8%) in October.
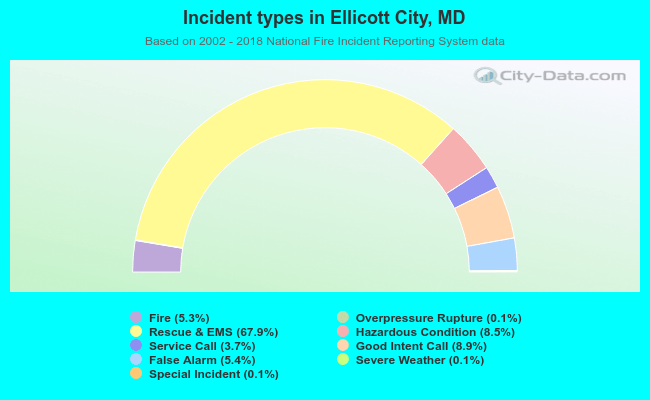 Out of all 43,981 cases reported during the years 2002 - 2018, the most belonged to the categories: Rescue & EMS (67.9%), Good Intent Call (8.9%), and Hazardous Condition (8.5%).
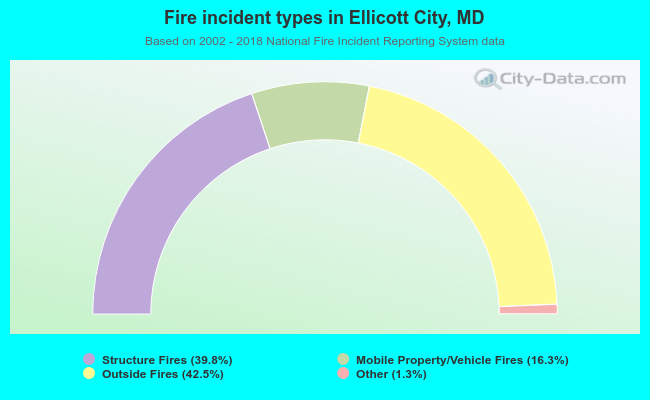 When looking into fire subcategories, the most reports belonged to: Outside Fires (42.5%), and Structure Fires (39.8%).