Eugene: Fire Incidents, Oregon (OR)
Where are fire incidents reported in Eugene, OR
Something went wrong! Please refresh the page.
| Fire incidents reported | |
|---|---|
| Sreet name | Count |
| 11TH AVE | 336 |
| FRANKLIN BLVD | 272 |
| COBURG RD | 234 |
| WILLAMETTE ST | 194 |
| HWY 99N | 188 |
| BAILEY HILL RD | 186 |
| BARGER DR | 154 |
| BROADWAY | 154 |
| RIVER RD | 150 |
| 6TH AVE | 148 |
| 7TH AVE | 148 |
| ROYAL AVE | 146 |
| 18TH AVE | 142 |
| MAXWELL RD | 132 |
| 13TH AVE | 126 |
| HILYARD ST | 126 |
| TERRY ST | 124 |
| PRAIRIE RD | 122 |
| KINSROW AVE | 112 |
| ROOSEVELT BLVD | 110 |
| 5TH AVE | 90 |
| 99 HWY | 88 |
| DANEBO AVE | 88 |
| WILLAKENZIE RD | 88 |
| CHAMBERS ST | 86 |
| 15TH AVE | 84 |
| 8TH AVE | 84 |
| 19TH AVE | 82 |
| HIGH ST | 82 |
| DIVISION AVE | 80 |
| Other | 3,939 |
2002 - 2018 National Fire Incident Reporting System (NFIRS) incidents
- Incident types reported to NFIRS in Eugene, OR
- 56,38966.3%Rescue & EMS
- 9,08610.7%Good Intent Call
- 8,0959.5%Fire
- 6,6937.9%Service Call
- 2,6083.1%False Alarm
- 1,9912.3%Hazardous Condition
- 1280.2%Overpressure Rupture
- Fire incident types reported to NFIRS in Eugene, OR
- 4,20551.9%Outside Fires
- 2,37929.4%Structure Fires
- 1,15914.3%Mobile Property/Vehicle Fires
- 3524.3%Other
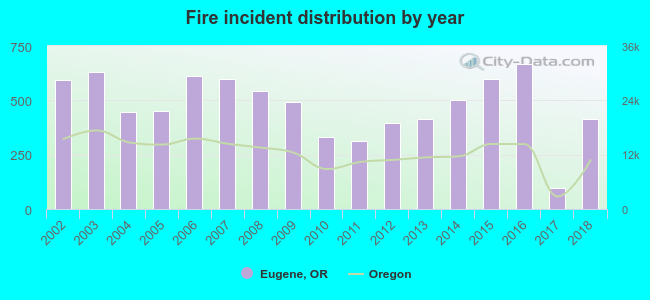 Based on the data from the years 2002 - 2018 the average number of fire incidents per year is 476. The highest number of reported fire incidents - 665 took place in 2016, and the least - 97 in 2017. The data has a decreasing trend.
The average number of yearly fire incidents per 10k residents in Eugene, OR compared to nearest cities:
(Note: Based on data for the last 3 years, including only cities with population 5,000 and above)
| Eugene: | 24.4 |
| Springfield: | 18.4 |
| Pleasant Hill: | 45.9 |
| Creswell: | 24.8 |
| Junction City: | 44.4 |
| Cottage Grove: | 26.7 |
| Sweet Home: | 30.3 |
| Lebanon: | 31.7 |
| Corvallis: | 10.1 |
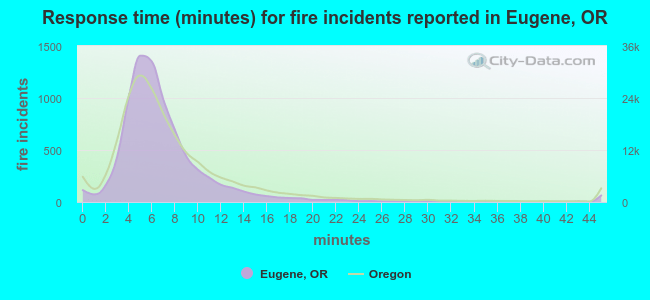 The median response time based on all reported fire incidents is 6 minutes. This is similar to the state median value.
The median response time in Eugene, OR compared to nearest cities:
(Note: Based on data for all years, including only cities with at least 500 fire incidents)
| Eugene: | 6 minutes |
| Springfield: | 5 minutes |
| Junction City: | 9 minutes |
| Cottage Grove: | 6 minutes |
| Sweet Home: | 7 minutes |
| Lebanon: | 6 minutes |
| Corvallis: | 6 minutes |
| Albany: | 6 minutes |
| Sutherlin: | 6 minutes |
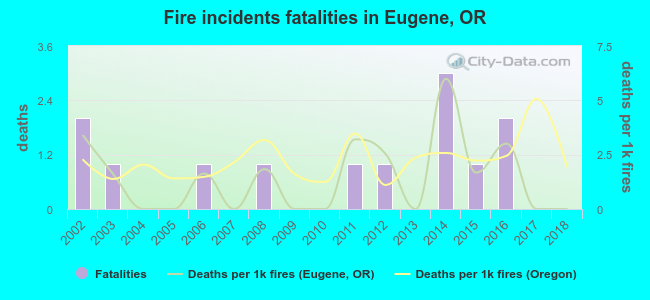 Based on the data from the years 2002 - 2018 the average number of fire-related yearly deaths is 1. The highest number of reported deaths - 3 took place in 2014, and the lowest - 0 in 2004. The data has a dropping trend.
The average number of fatalities per 1,000 fire incidents is 1. This indicator was the highest - 6 in 2014, and the lowest 0 in 2004. The trend for deaths per 1,000 fire incidents is dropping. Compared to the state value the number of deaths per 1,000 fires is lower.
Based on the data from the years 2002 - 2018 the average number of fire-related yearly deaths is 1. The highest number of reported deaths - 3 took place in 2014, and the lowest - 0 in 2004. The data has a dropping trend.
The average number of fatalities per 1,000 fire incidents is 1. This indicator was the highest - 6 in 2014, and the lowest 0 in 2004. The trend for deaths per 1,000 fire incidents is dropping. Compared to the state value the number of deaths per 1,000 fires is lower.Deaths per 1,000 incidents in Eugene, OR compared to nearest cities:
(Note: Based on data for all years, including only cities with at least 2,500 fire incidents)
| Eugene: | 1.6 |
| Springfield: | 2.1 |
| Albany: | 2.2 |
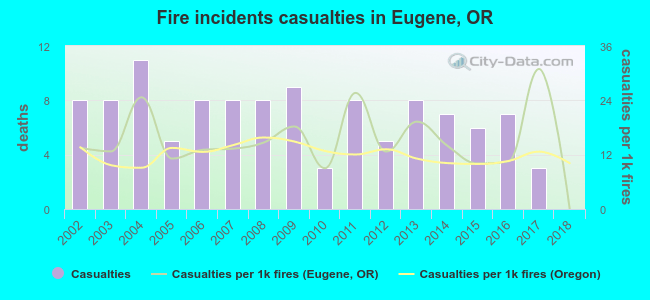 Based on the reports from the years 2002 - 2018 the average number of fire-related yearly casualties is 7. The highest number of reported casualties - 11 took place in 2004, and the lowest - 0 in 2018. The data has a declining trend.
The average number of injuries per 1,000 fire incidents is 15. This indicator was the highest - 31 in 2017, and the lowest 0 in 2018. The trend for injuries per 1,000 fires is dropping. Compared to the state value the number of casualties per 1,000 incidents is about the same.
Based on the reports from the years 2002 - 2018 the average number of fire-related yearly casualties is 7. The highest number of reported casualties - 11 took place in 2004, and the lowest - 0 in 2018. The data has a declining trend.
The average number of injuries per 1,000 fire incidents is 15. This indicator was the highest - 31 in 2017, and the lowest 0 in 2018. The trend for injuries per 1,000 fires is dropping. Compared to the state value the number of casualties per 1,000 incidents is about the same.Casualties per 1,000 incidents in Eugene, OR compared to nearest cities:
(Note: Based on data for all years, including only cities with at least 500 fire incidents)
| Eugene: | 13.8 |
| Springfield: | 22.3 |
| Junction City: | 7.4 |
| Cottage Grove: | 5.0 |
| Sweet Home: | 20.6 |
| Lebanon: | 24.2 |
| Corvallis: | 5.4 |
| Albany: | 14.5 |
| Sutherlin: | 8.1 |
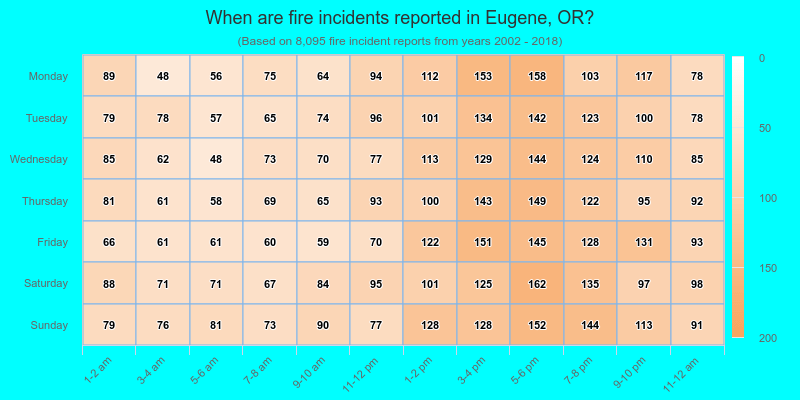
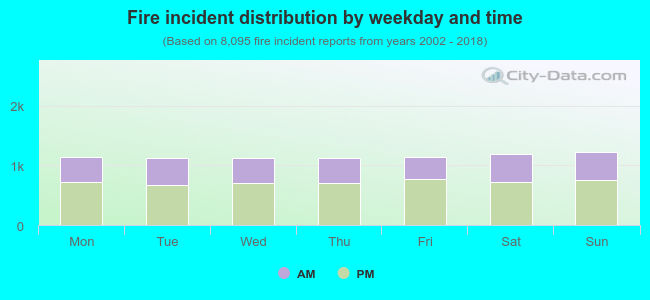 37.6% incidents where reported in the morning and 62.4% in the evening. The most fires (15.2%) took place on Sunday, and the least (13.8%) on Wednesday.
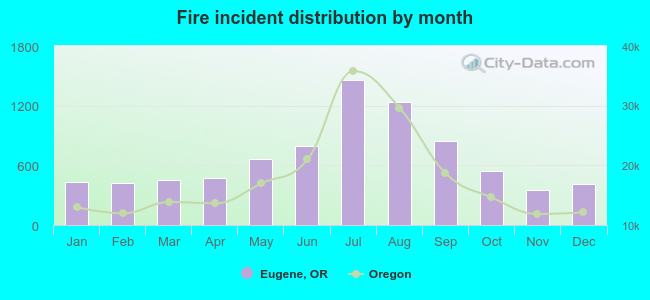 According to the 8,095 incident reports from years 2002 - 2018 most fires (18.0%) took place during July, and the least (4.4%) in November.
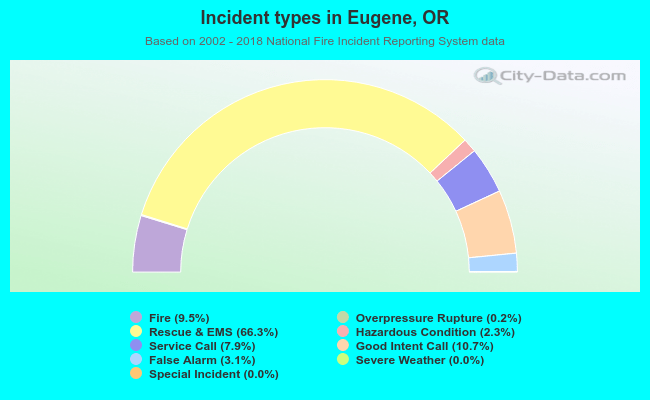 Out of all 85,040 cases reported during the years 2002 - 2018, the most belonged to the categories: Rescue & EMS (66.3%), Good Intent Call (10.7%), and Fire (9.5%).
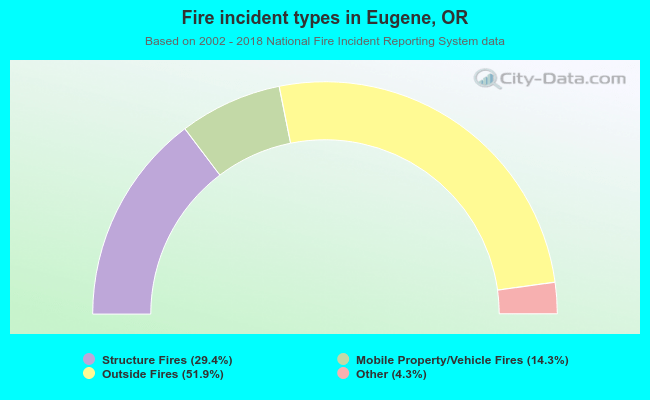 When looking into fire subcategories, the most incidents belonged to: Outside Fires (51.9%), and Structure Fires (29.4%).