Springfield: Fire Incidents, Oregon (OR)
Where are fire incidents reported in Springfield, OR
Something went wrong! Please refresh the page.
| Fire incidents reported | |
|---|---|
| Sreet name | Count |
| MAIN ST | 398 |
| GATEWAY ST | 306 |
| OLYMPIC ST | 136 |
| MARCOLA RD | 124 |
| 42ND ST | 122 |
| A ST | 102 |
| 28TH ST | 98 |
| MCKENZIE HWY | 90 |
| CENTENNIAL BLVD | 88 |
| E ST | 84 |
| 5TH ST | 82 |
| F ST | 80 |
| DAISY ST | 76 |
| CAMP CREEK RD | 72 |
| D ST | 70 |
| MOHAWK BLVD | 70 |
| Q ST | 64 |
| G ST | 60 |
| 30TH ST | 56 |
| HARLOW RD | 56 |
| J ST | 56 |
| JASPER RD | 54 |
| THURSTON RD | 54 |
| 32ND ST | 48 |
| C ST | 48 |
| 48TH ST | 46 |
| LINDALE DR | 46 |
| M ST | 46 |
| 58TH ST | 44 |
| 7TH ST | 44 |
| Other | 553 |
2002 - 2018 National Fire Incident Reporting System (NFIRS) incidents
- Incident types reported to NFIRS in Springfield, OR
- 21,03867.6%Rescue & EMS
- 3,27310.5%Fire
- 2,7618.9%Good Intent Call
- 2,6438.5%Service Call
- 6852.2%False Alarm
- 6362.0%Hazardous Condition
- 360.1%Overpressure Rupture
- Fire incident types reported to NFIRS in Springfield, OR
- 1,53446.9%Outside Fires
- 1,11334.0%Structure Fires
- 53216.3%Mobile Property/Vehicle Fires
- 942.9%Other
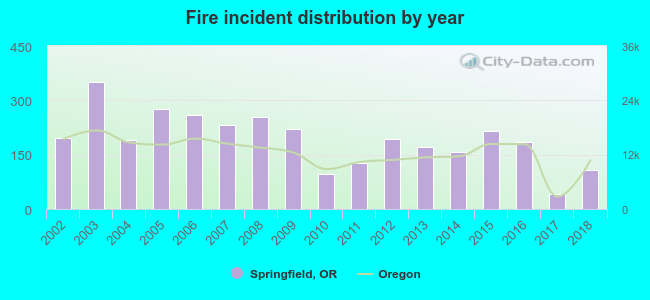 According to the data from the years 2002 - 2018 the average number of fires per year is 193. The highest number of reported fire incidents - 351 took place in 2003, and the least - 41 in 2017. The data has a decreasing trend.
The average number of yearly fire incidents per 10k residents in Springfield, OR compared to nearest cities:
(Note: Based on data for the last 3 years, including only cities with population 5,000 and above)
| Springfield: | 18.4 |
| Pleasant Hill: | 45.9 |
| Eugene: | 24.4 |
| Creswell: | 24.8 |
| Junction City: | 44.4 |
| Cottage Grove: | 26.7 |
| Sweet Home: | 30.3 |
| Lebanon: | 31.7 |
| Corvallis: | 10.1 |
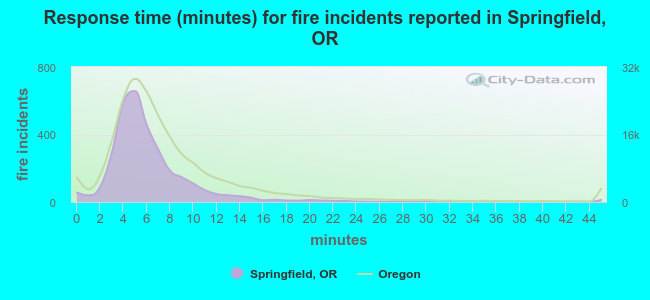 The median response time based on all reported fire incidents is 5 minutes. This is lower compared to the Oregon median value.
The median response time in Springfield, OR compared to nearest cities:
(Note: Based on data for all years, including only cities with at least 500 fire incidents)
| Springfield: | 5 minutes |
| Eugene: | 6 minutes |
| Junction City: | 9 minutes |
| Cottage Grove: | 6 minutes |
| Sweet Home: | 7 minutes |
| Lebanon: | 6 minutes |
| Corvallis: | 6 minutes |
| Albany: | 6 minutes |
| Sutherlin: | 6 minutes |
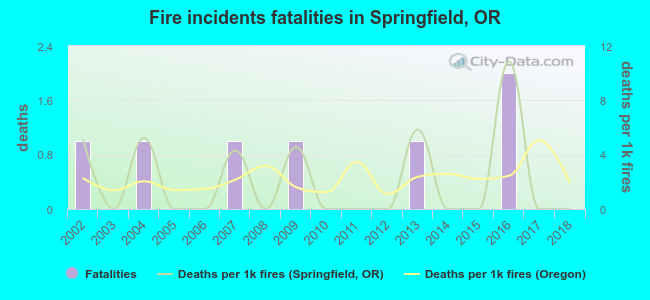 Based on the data from the years 2002 - 2018 the average number of fire-related fatalities per year is 0. The highest number of deaths - 2 took place in 2016, and the lowest - 0 in 2003. The data has a decreasing trend.
The average number of fatalities per 1,000 fire incidents is 2. This indicator was the highest - 11 in 2016, and the lowest 0 in 2003. The trend for deaths per 1,000 fire incidents is decreasing. Compared to the state value the number of fatalities per 1,000 fire incidents is similar.
Based on the data from the years 2002 - 2018 the average number of fire-related fatalities per year is 0. The highest number of deaths - 2 took place in 2016, and the lowest - 0 in 2003. The data has a decreasing trend.
The average number of fatalities per 1,000 fire incidents is 2. This indicator was the highest - 11 in 2016, and the lowest 0 in 2003. The trend for deaths per 1,000 fire incidents is decreasing. Compared to the state value the number of fatalities per 1,000 fire incidents is similar.
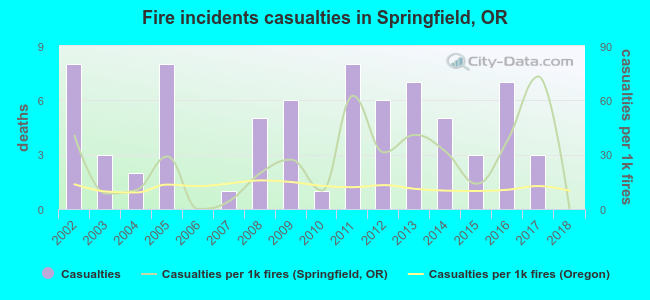 Based on the data from the years 2002 - 2018 the average number of fire-related yearly casualties is 4. The highest number of injuries - 8 took place in 2002, and the lowest - 0 in 2006. The data has a dropping trend.
The average number of casualties per 1,000 fire incidents is 26. This indicator was the highest - 73 in 2017, and the lowest 0 in 2006. The trend for casualties per 1,000 incidents is declining. Compared to the state value the number of casualties per 1,000 fire incidents is higher.
Based on the data from the years 2002 - 2018 the average number of fire-related yearly casualties is 4. The highest number of injuries - 8 took place in 2002, and the lowest - 0 in 2006. The data has a dropping trend.
The average number of casualties per 1,000 fire incidents is 26. This indicator was the highest - 73 in 2017, and the lowest 0 in 2006. The trend for casualties per 1,000 incidents is declining. Compared to the state value the number of casualties per 1,000 fire incidents is higher.Casualties per 1,000 incidents in Springfield, OR compared to nearest cities:
(Note: Based on data for all years, including only cities with at least 500 fire incidents)
| Springfield: | 22.3 |
| Eugene: | 13.8 |
| Junction City: | 7.4 |
| Cottage Grove: | 5.0 |
| Sweet Home: | 20.6 |
| Lebanon: | 24.2 |
| Corvallis: | 5.4 |
| Albany: | 14.5 |
| Sutherlin: | 8.1 |
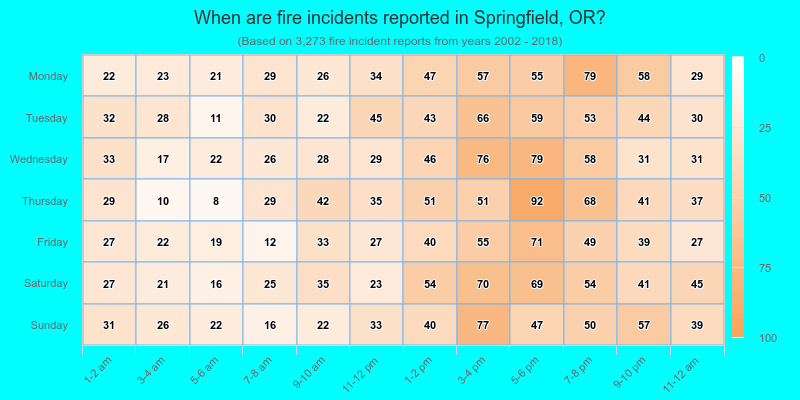
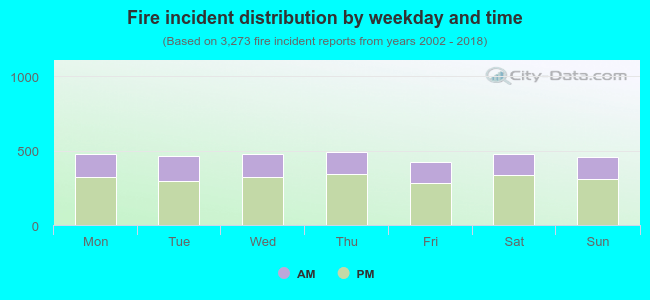 32.6% incidents where reported in the morning and 67.4% in the evening. The most fires (15.1%) took place on Thursday, and the least (12.9%) on Friday.
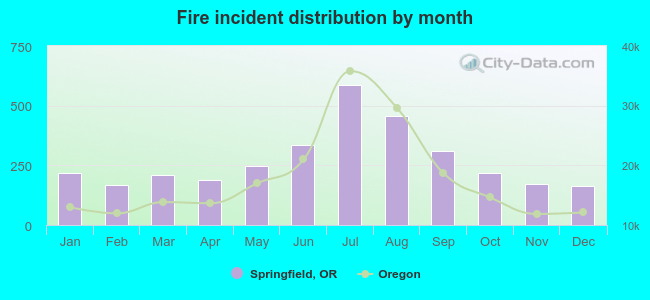 According to the 3,273 reports from years 2002 - 2018 most fires (17.9%) took place during July, and the least (4.9%) in December.
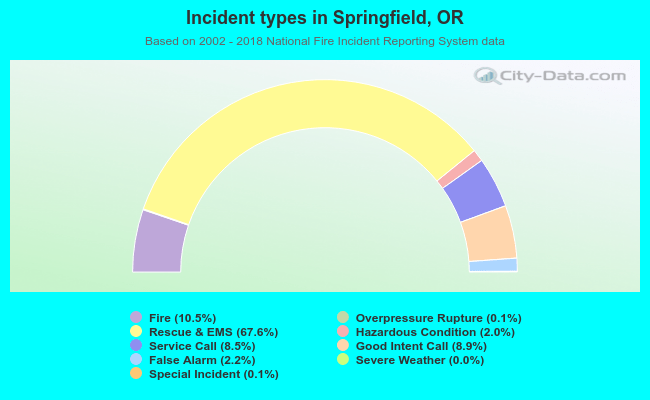 Out of all 31,099 cases reported during the years 2002 - 2018, the most belonged to the categories: Rescue & EMS (67.6%), Fire (10.5%), and Good Intent Call (8.9%).
 When looking into fire subcategories, the most incidents belonged to: Outside Fires (46.9%), and Structure Fires (34.0%).