Eustis: Fire Incidents, Florida (FL)
Where are fire incidents reported in Eustis, FL
Something went wrong! Please refresh the page.
| Fire incidents reported | |
|---|---|
| Sreet name | Count |
| BAY ST | 134 |
| SR 44 | 134 |
| GROVE ST | 80 |
| CR 44A | 74 |
| ORANGE AVE | 70 |
| 44 | 68 |
| FOREST DR | 56 |
| BATES AVE | 50 |
| CR 439 | 50 |
| KURT ST | 46 |
| ROYAL TRAILS RD | 44 |
| CR 44 | 40 |
| LAKE NORRIS RD | 38 |
| 44A | 36 |
| ARDICE AVE | 36 |
| US HWY 441 | 36 |
| WASHINGTON AVE | 34 |
| LEMON AVE | 30 |
| MCDONALD AVE | 30 |
| CENTER ST | 28 |
| LAKE DR | 28 |
| SWIFT RD | 28 |
| CARDINAL ST | 24 |
| EUSTIS ST | 24 |
| SR 19 | 24 |
| LAKESHORE DR | 22 |
| RULEME ST | 22 |
| US HWY 441 HWY | 22 |
| COUNTRY RD | 20 |
| CR 452 | 20 |
| Other | 1,070 |
2002 - 2018 National Fire Incident Reporting System (NFIRS) incidents
- Incident types reported to NFIRS in Eustis, FL
- 17,40662.0%Rescue & EMS
- 2,5078.9%Good Intent Call
- 2,4188.6%Fire
- 2,3108.2%Service Call
- 2,1797.8%Hazardous Condition
- 1,1674.2%False Alarm
- 400.1%Special Incident
- 310.1%Overpressure Rupture
- Fire incident types reported to NFIRS in Eustis, FL
- 1,15247.6%Outside Fires
- 79933.0%Structure Fires
- 33413.8%Mobile Property/Vehicle Fires
- 1335.5%Other
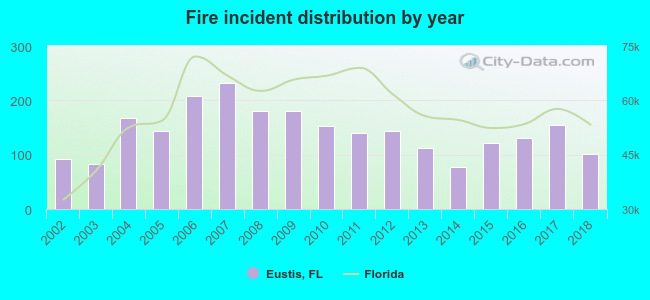 According to the data from the years 2002 - 2018 the average number of fire incidents per year is 142. The highest number of reported fires - 231 took place in 2007, and the least - 77 in 2014. The data has a growing trend.
The average number of yearly fire incidents per 10k residents in Eustis, FL compared to nearest cities:
(Note: Based on data for the last 3 years, including only cities with population 5,000 and above)
| Eustis: | 66.1 |
| Mount Dora: | 58.9 |
| Tavares: | 64.1 |
| Leesburg: | 110.9 |
| Apopka: | 42.1 |
| Lady Lake: | 50.0 |
| The Villages: | 6.6 |
| Minneola: | 39.9 |
| Winter Garden: | 38.1 |
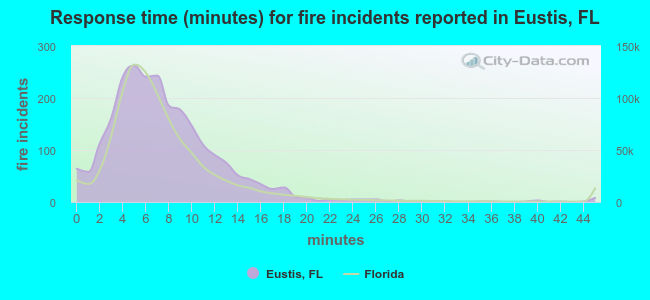 The median response time based on all reported fire incidents is 7 minutes. This is similar to the state median value.
The median response time in Eustis, FL compared to nearest cities:
(Note: Based on data for all years, including only cities with at least 500 fire incidents)
| Eustis: | 7 minutes |
| Mount Dora: | 6 minutes |
| Tavares: | 6 minutes |
| Umatilla: | 9 minutes |
| Sorrento: | 8 minutes |
| Leesburg: | 7 minutes |
| Fruitland Park: | 7 minutes |
| Apopka: | 5 minutes |
| Lady Lake: | 7 minutes |
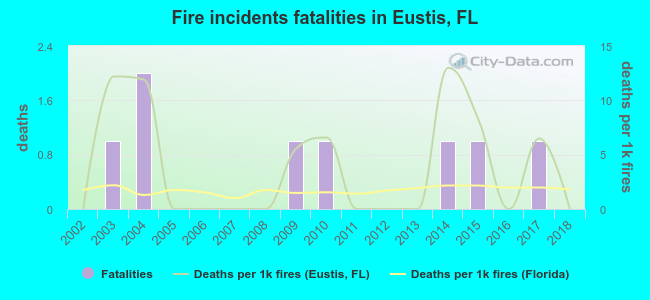 According to the reports from the years 2002 - 2018 the average number of fire-related fatalities per year is 0. The highest number of reported deaths - 2 took place in 2004, and the lowest - 0 in 2002. The data has a constant trend.
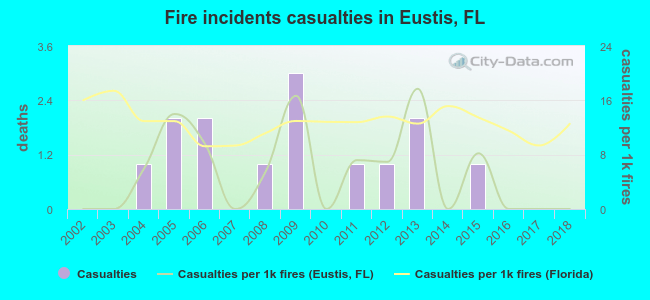 Based on the reports from the years 2002 - 2018 the average number of fire-related casualties per year is 1. The highest number of injuries - 3 took place in 2009, and the lowest - 0 in 2002. The data has a constant trend.
The average number of casualties per 1,000 fires is 5. This indicator was the highest - 18 in 2013, and the lowest 0 in 2002. The trend for casualties per 1,000 incidents is constant. Compared to the Florida value the number of injuries per 1,000 incidents is much lower.
Based on the reports from the years 2002 - 2018 the average number of fire-related casualties per year is 1. The highest number of injuries - 3 took place in 2009, and the lowest - 0 in 2002. The data has a constant trend.
The average number of casualties per 1,000 fires is 5. This indicator was the highest - 18 in 2013, and the lowest 0 in 2002. The trend for casualties per 1,000 incidents is constant. Compared to the Florida value the number of injuries per 1,000 incidents is much lower.Casualties per 1,000 incidents in Eustis, FL compared to nearest cities:
(Note: Based on data for all years, including only cities with at least 500 fire incidents)
| Eustis: | 5.8 |
| Mount Dora: | 11.7 |
| Tavares: | 2.5 |
| Umatilla: | 0.8 |
| Sorrento: | 5.4 |
| Leesburg: | 4.8 |
| Fruitland Park: | 2.4 |
| Apopka: | 11.3 |
| Lady Lake: | 3.0 |
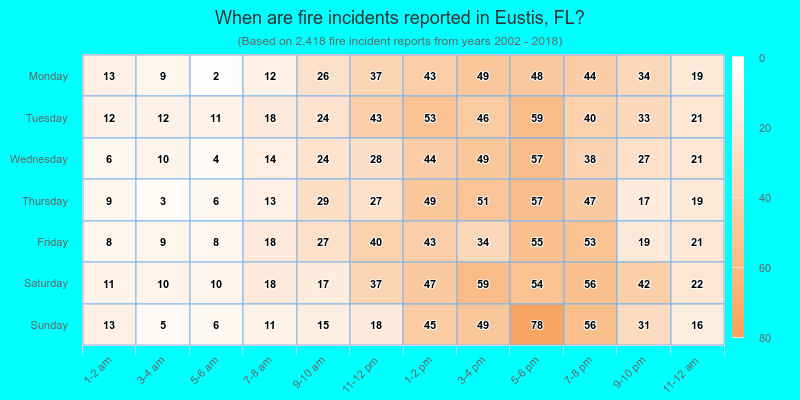
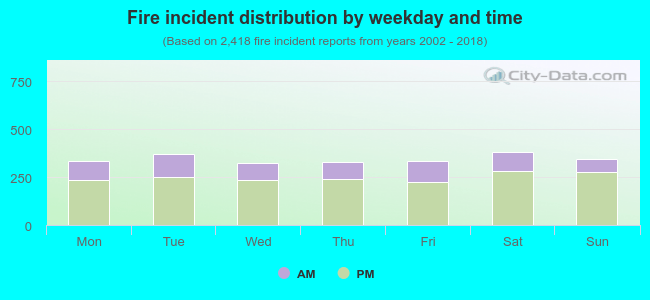 27.8% incidents where reported in the morning and 72.2% in the evening. The most fires (15.8%) took place on Saturday, and the least (13.3%) on Wednesday.
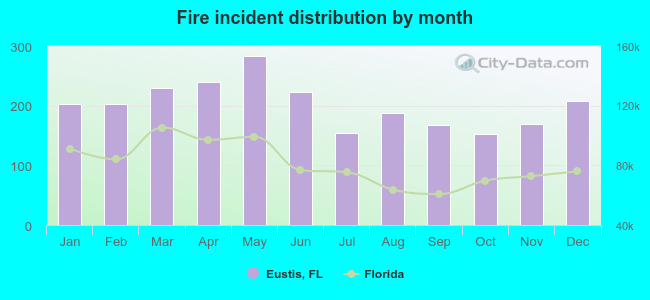 Based on the 2,418 fires from years 2002 - 2018 most fires (11.7%) took place during May, and the least (6.3%) in October.
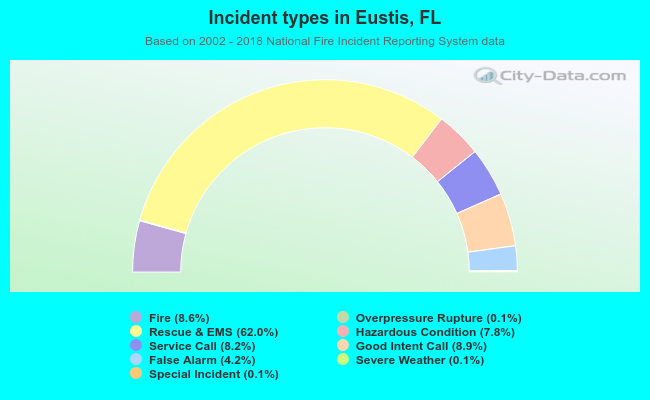 Out of all 28,074 cases reported during the years 2002 - 2018, the most belonged to the categories: Rescue & EMS (62.0%), Good Intent Call (8.9%), and Fire (8.6%).
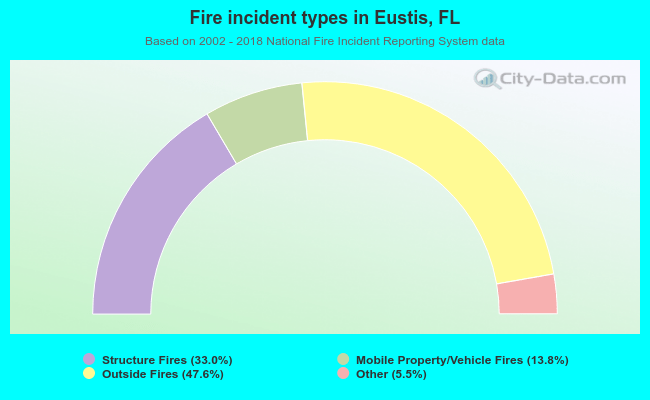 When looking into fire subcategories, the most reports belonged to: Outside Fires (47.6%), and Structure Fires (33.0%).