The Villages: Fire Incidents, Florida (FL)
Where are fire incidents reported in The Villages, FL
Something went wrong! Please refresh the page.
| Fire incidents reported | |
|---|---|
| Sreet name | Count |
| EL CAMINO REAL | 34 |
| MAIN ST | 26 |
| BICHARA BLVD | 24 |
| CR 466 | 24 |
| WEDGEWOOD LN | 18 |
| CR 466 (4313-6804) | 16 |
| US HWY 441 | 16 |
| BAILEY TRL | 14 |
| LAUREL MANOR DR | 14 |
| US HWY 27/441(LV 600-1100 | 14 |
| WEDGEWOOD (3102-3600) LN | 14 |
| COLONY BLVD | 12 |
| MORSE BLVD | 12 |
| MULBERRY LN | 12 |
| 466 | 10 |
| CANAL (1000-1130) ST | 10 |
| CANAL ST | 10 |
| 165TH MULBERRY LN | 8 |
| AVENIDA CENTRAL | 8 |
| AZTECA LOOP | 8 |
| CARRERA DR | 8 |
| CASA BELLA | 8 |
| CR 466 (6805-9000) | 8 |
| CR 472 | 8 |
| HENDRY DR | 8 |
| KENMORE LN | 8 |
| LAKESHORE DR | 8 |
| NE 72ND BLVD | 8 |
| OLD CAMP RD | 8 |
| PALMER WAY | 8 |
| Other | 677 |
2003 - 2018 National Fire Incident Reporting System (NFIRS) incidents
- Incident types reported to NFIRS in The Villages, FL
- 21,18249.3%Rescue & EMS
- 15,52436.1%Service Call
- 2,2465.2%Good Intent Call
- 1,5413.6%Hazardous Condition
- 1,2352.9%False Alarm
- 1,0612.5%Fire
- 930.2%Special Incident
- 660.2%Severe Weather
- Fire incident types reported to NFIRS in The Villages, FL
- 49646.7%Structure Fires
- 38436.2%Outside Fires
- 13112.3%Mobile Property/Vehicle Fires
- 504.7%Other
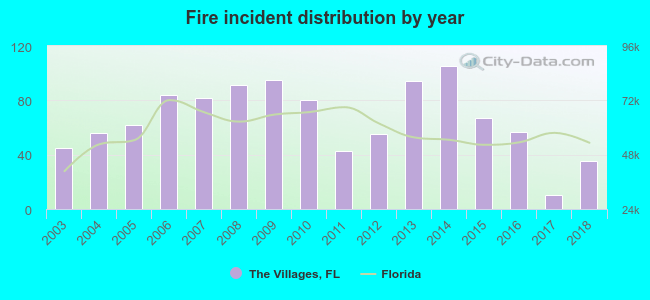 Based on the data from the years 2003 - 2018 the average number of fires per year is 66. The highest number of reported fires - 105 took place in 2014, and the least - 10 in 2017. The data has a decreasing trend.
The average number of yearly fire incidents per 10k residents in The Villages, FL compared to nearest cities:
(Note: Based on data for the last 3 years, including only cities with population 5,000 and above)
| The Villages: | 6.6 |
| Lady Lake: | 50.0 |
| Wildwood: | 141.6 |
| Leesburg: | 110.9 |
| Tavares: | 64.1 |
| Eustis: | 66.1 |
| Ocala: | 141.4 |
| Mount Dora: | 58.9 |
| Inverness: | 81.9 |
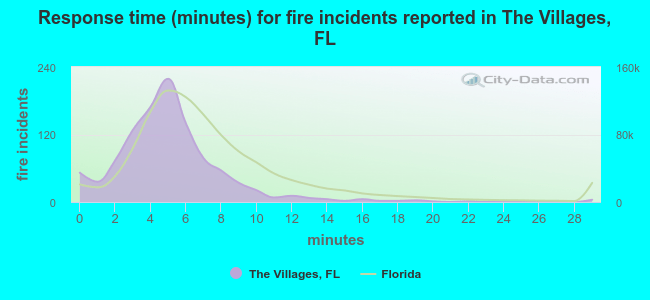 The median response time based on all reported fire incidents is 5 minutes. This is lower compared to the state median value.
The median response time in The Villages, FL compared to nearest cities:
(Note: Based on data for all years, including only cities with at least 500 fire incidents)
| The Villages: | 5 minutes |
| Lady Lake: | 7 minutes |
| Fruitland Park: | 7 minutes |
| Wildwood: | 8 minutes |
| Belleview: | 8 minutes |
| Leesburg: | 7 minutes |
| Tavares: | 6 minutes |
| Eustis: | 7 minutes |
| Umatilla: | 9 minutes |
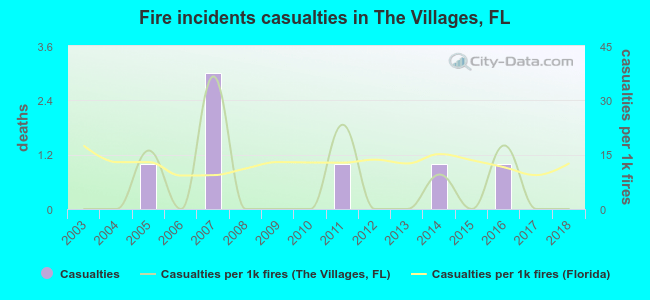 According to the data from the years 2003 - 2018 the average number of fire-related yearly casualties is 0. The highest number of injuries - 3 took place in 2007, and the lowest - 0 in 2003. The data has a constant trend.
The average number of injuries per 1,000 fires is 6. This indicator was the highest - 37 in 2007, and the lowest 0 in 2003. The trend for injuries per 1,000 fires is constant. Compared to the Florida value the number of injuries per 1,000 incidents is lower.
According to the data from the years 2003 - 2018 the average number of fire-related yearly casualties is 0. The highest number of injuries - 3 took place in 2007, and the lowest - 0 in 2003. The data has a constant trend.
The average number of injuries per 1,000 fires is 6. This indicator was the highest - 37 in 2007, and the lowest 0 in 2003. The trend for injuries per 1,000 fires is constant. Compared to the Florida value the number of injuries per 1,000 incidents is lower.
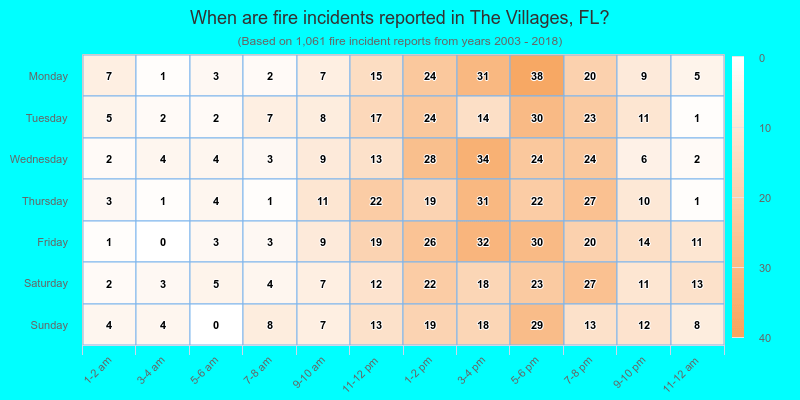
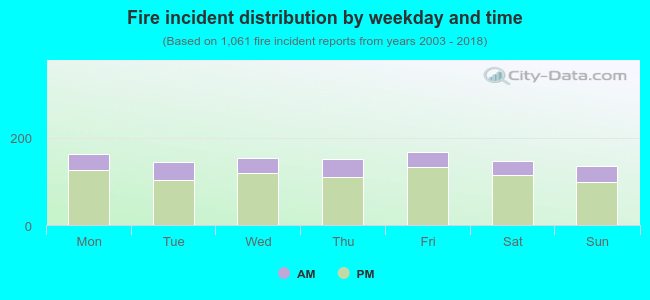 24.2% incidents where reported in the morning and 75.8% in the evening. The most fires (15.8%) took place on Friday, and the least (12.7%) on Sunday.
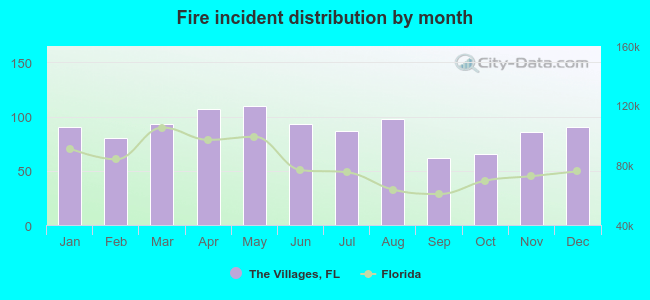 Based on the 1,061 fire incidents from years 2003 - 2018 most fires (10.4%) took place during May, and the least (5.8%) in September.
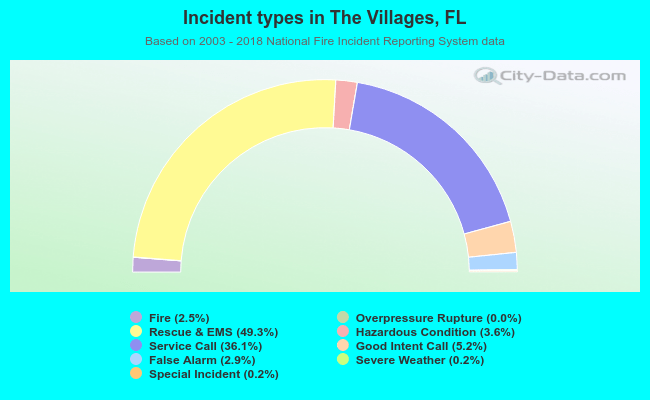 Out of all 42,963 cases reported during the years 2003 - 2018, the most belonged to the categories: Rescue & EMS (49.3%), Service Call (36.1%), and Good Intent Call (5.2%).
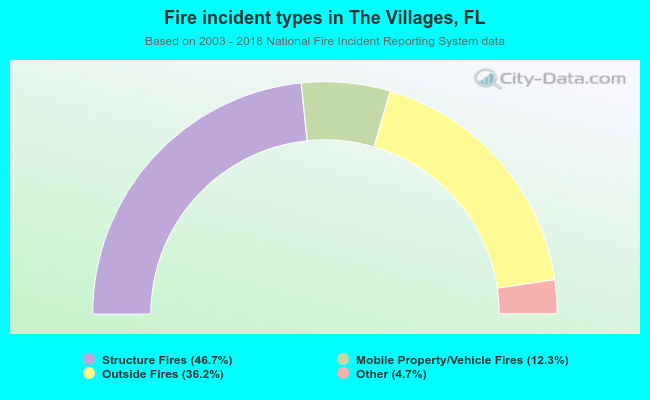 When looking into fire subcategories, the most reports belonged to: Structure Fires (46.7%), and Outside Fires (36.2%).