Evans: Fire Incidents, Colorado (CO)
Where are fire incidents reported in Evans, CO
Something went wrong! Please refresh the page.
| Fire incidents reported | |
|---|---|
| Sreet name | Count |
| 37TH ST | 94 |
| 11TH AVE | 62 |
| 42ND ST | 58 |
| 49TH ST | 44 |
| DENVER ST | 42 |
| 23RD AVE | 32 |
| 31ST ST | 28 |
| 32ND ST | 26 |
| CRESCENT COVE DR | 26 |
| GLENDALE DR | 26 |
| STATE FARM RD | 26 |
| 17TH AVE | 24 |
| CENTRAL ST | 22 |
| GOLDEN ST | 22 |
| RIVERSIDE PKY | 22 |
| MONTROSE ST | 20 |
| PUEBLO ST | 20 |
| BOULDER ST | 18 |
| PLEASANT ACRES DR | 18 |
| 85 HWY | 16 |
| 8TH AVE | 16 |
| EMPIRE ST | 16 |
| STATE ST | 16 |
| 34TH ST | 14 |
| 35TH AVE | 14 |
| 36TH ST | 14 |
| 39TH ST | 14 |
| SERVICE RD | 14 |
| MYRTLE ST | 12 |
| 1ST AVE | 10 |
| Other | 60 |
2003 - 2018 National Fire Incident Reporting System (NFIRS) incidents
- Incident types reported to NFIRS in Evans, CO
- 5,89658.4%Rescue & EMS
- 1,50214.9%Good Intent Call
- 8468.4%Fire
- 7657.6%Hazardous Condition
- 5805.7%Service Call
- 4564.5%False Alarm
- 270.3%Severe Weather
- 120.1%Overpressure Rupture
- Fire incident types reported to NFIRS in Evans, CO
- 36943.6%Outside Fires
- 36543.1%Structure Fires
- 9311.0%Mobile Property/Vehicle Fires
- 192.2%Other
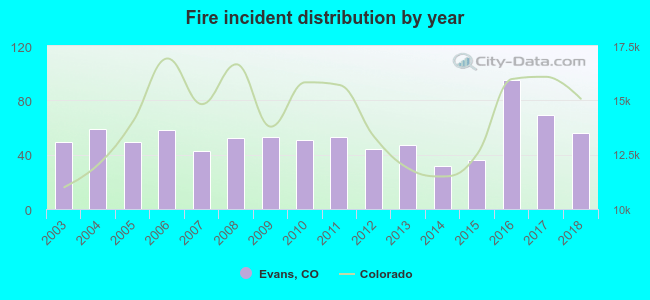 According to the data from the years 2003 - 2018 the average number of fires per year is 53. The highest number of reported fire incidents - 95 took place in 2016, and the least - 32 in 2014. The data has a growing trend.
The average number of yearly fire incidents per 10k residents in Evans, CO compared to nearest cities:
(Note: Based on data for the last 3 years, including only cities with population 5,000 and above)
| Evans: | 35.8 |
| Greeley: | 21.7 |
| Milliken: | 36.7 |
| Johnstown: | 33.8 |
| Windsor: | 20.8 |
| Loveland: | 23.6 |
| Berthoud: | 96.4 |
| Firestone: | 34.4 |
| Fort Lupton: | 77.9 |
 The median response time based on all reported fire incidents is 6 minutes. This is about the same as the Colorado median value.
The median response time in Evans, CO compared to nearest cities:
(Note: Based on data for all years, including only cities with at least 500 fire incidents)
| Evans: | 6 minutes |
| Greeley: | 7 minutes |
| Kersey: | 10 minutes |
| Eaton: | 8 minutes |
| Johnstown: | 9 minutes |
| Windsor: | 7 minutes |
| Platteville: | 9 minutes |
| Loveland: | 6 minutes |
| Berthoud: | 9 minutes |
 According to the data from the years 2003 - 2018 the average number of fire-related casualties per year is 0. The highest number of reported casualties - 2 took place in 2016, and the lowest - 0 in 2003. The data has a constant trend.
The average number of casualties per 1,000 fires is 6. This indicator was the highest - 31 in 2014, and the lowest 0 in 2003. The trend for casualties per 1,000 fire incidents is constant. Compared to the state value the number of casualties per 1,000 fire incidents is much lower.
According to the data from the years 2003 - 2018 the average number of fire-related casualties per year is 0. The highest number of reported casualties - 2 took place in 2016, and the lowest - 0 in 2003. The data has a constant trend.
The average number of casualties per 1,000 fires is 6. This indicator was the highest - 31 in 2014, and the lowest 0 in 2003. The trend for casualties per 1,000 fire incidents is constant. Compared to the state value the number of casualties per 1,000 fire incidents is much lower.
 26.1% incidents where reported in the morning and 73.9% in the evening. The most fires (16.4%) took place on Wednesday, and the least (11.8%) on Tuesday.
 Based on the 846 incident reports from years 2003 - 2018 most fires (12.2%) took place during June, and the least (5.1%) in January.
 Out of all 10,089 cases reported during the years 2003 - 2018, the most belonged to the categories: Rescue & EMS (58.4%), Good Intent Call (14.9%), and Fire (8.4%).
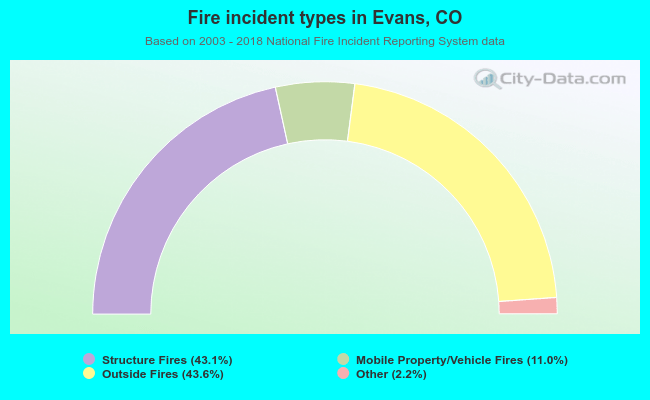 When looking into fire subcategories, the most reports belonged to: Outside Fires (43.6%), and Structure Fires (43.1%).