Firestone: Fire Incidents, Colorado (CO)
Where are fire incidents reported in Firestone, CO
Something went wrong! Please refresh the page.
|
| |||||||||||||||||||||||||||||||||||||||||||||||||||||||||||||||||||||||||||||||||||||||||||||||||||||||||||||
2006 - 2018 National Fire Incident Reporting System (NFIRS) incidents
- Incident types reported to NFIRS in Firestone, CO
- 2,49564.0%Rescue & EMS
- 3478.9%Fire
- 3278.4%Good Intent Call
- 2787.1%Hazardous Condition
- 2476.3%False Alarm
- 1934.9%Service Call
- 70.2%Overpressure Rupture
- 40.1%Special Incident
- Fire incident types reported to NFIRS in Firestone, CO
- 20057.6%Outside Fires
- 9928.5%Structure Fires
- 339.5%Mobile Property/Vehicle Fires
- 154.3%Other
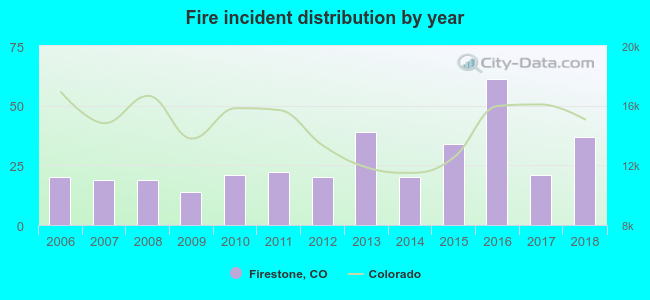 Based on the data from the years 2006 - 2018 the average number of fires per year is 27. The highest number of reported fire incidents - 61 took place in 2016, and the least - 14 in 2009. The data has an increasing trend.
The average number of yearly fire incidents per 10k residents in Firestone, CO compared to nearest cities:
(Note: Based on data for the last 3 years, including only cities with population 5,000 and above)
| Firestone: | 34.4 |
| Frederick: | 21.7 |
| Fort Lupton: | 77.9 |
| Erie: | 26.0 |
| Longmont: | 28.6 |
| Brighton: | 35.8 |
| Lafayette: | 23.8 |
| Gunbarrel: | 7.6 |
| Berthoud: | 96.4 |

 According to the data from the years 2006 - 2018 the average number of fire-related yearly casualties is 0. The highest number of reported casualties - 2 took place in 2014, and the lowest - 0 in 2008. The data has a dropping trend.
 29.1% incidents where reported in the morning and 70.9% in the evening. The most fires (17.3%) took place on Saturday, and the least (9.8%) on Thursday.
 According to the 347 fire incident reports from years 2006 - 2018 most fires (15.6%) took place during March, and the least (2.9%) in November.
 Out of all 3,901 cases reported during the years 2006 - 2018, the most belonged to the categories: Rescue & EMS (64.0%), Fire (8.9%), and Good Intent Call (8.4%).
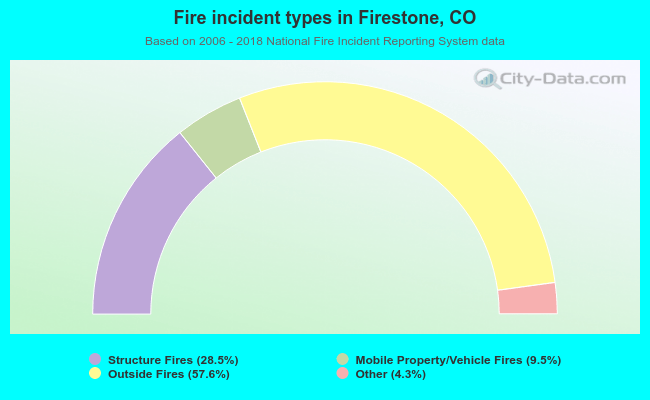 When looking into fire subcategories, the most reports belonged to: Outside Fires (57.6%), and Structure Fires (28.5%).