Evansville: Fire Incidents, Indiana (IN)
Where are fire incidents reported in Evansville, IN
Something went wrong! Please refresh the page.
| Fire incidents reported | |
|---|---|
| Sreet name | Count |
| GREEN RIVER RD | 382 |
| RIVERSIDE DR | 250 |
| BURKHARDT RD | 210 |
| FRANKLIN ST | 210 |
| WASHINGTON AVE | 204 |
| VIRGINIA ST | 202 |
| COVERT AVE | 180 |
| MARYLAND ST | 180 |
| ST JOSEPH AVE | 170 |
| COLUMBIA ST | 168 |
| MICHIGAN ST | 160 |
| LINCOLN AVE | 152 |
| 1ST AVE | 138 |
| LLOYD EX | 138 |
| MAIN ST | 138 |
| KENTUCKY AVE | 136 |
| FULTON AVE | 132 |
| WEINBACH AVE | 132 |
| BOONVILLE NEW HARMONY RD | 120 |
| WATERWORKS RD | 120 |
| LOUISIANA ST | 118 |
| US HIGHWAY 41 | 114 |
| BEDFORD AVE | 108 |
| ILLINOIS ST | 108 |
| JACKSON AVE | 106 |
| JEFFERSON AVE | 106 |
| GARVIN ST | 104 |
| BAKER AVE | 102 |
| IOWA ST | 102 |
| OLD HENDERSON RD | 102 |
| Other | 4,629 |
2003 - 2018 National Fire Incident Reporting System (NFIRS) incidents
- Incident types reported to NFIRS in Evansville, IN
- 10,89139.1%Hazardous Condition
- 9,22133.1%Fire
- 4,33815.6%Rescue & EMS
- 1,2364.4%False Alarm
- 1,1284.1%Good Intent Call
- 9443.4%Service Call
- Fire incident types reported to NFIRS in Evansville, IN
- 3,80341.2%Structure Fires
- 3,63839.5%Outside Fires
- 1,56917.0%Mobile Property/Vehicle Fires
- 2112.3%Other
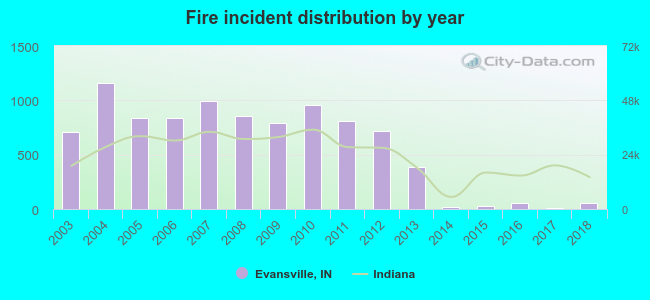 Based on the data from the years 2003 - 2018 the average number of fires per year is 576. The highest number of fires - 1,157 took place in 2004, and the least - 10 in 2017. The data has a declining trend.
The average number of yearly fire incidents per 10k residents in Evansville, IN compared to nearest cities:
(Note: Based on data for the last 3 years, including only cities with population 5,000 and above)
| Evansville: | 3.3 |
| Boonville: | 37.9 |
| Mount Vernon: | 52.7 |
| Princeton: | 8.7 |
| Huntingburg: | 22.6 |
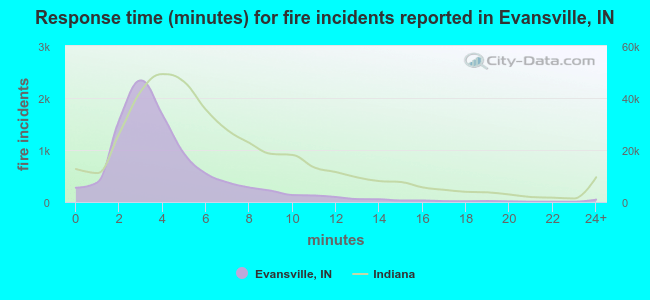 The median response time based on all reported fire incidents is 4 minutes. This is lower than the Indiana median value.
The median response time in Evansville, IN compared to nearest cities:
(Note: Based on data for all years, including only cities with at least 500 fire incidents)
| Evansville: | 4 minutes |
| Newburgh: | 7 minutes |
| Boonville: | 5 minutes |
| Princeton: | 4 minutes |
| Oakland City: | 5 minutes |
| Petersburg: | 10 minutes |
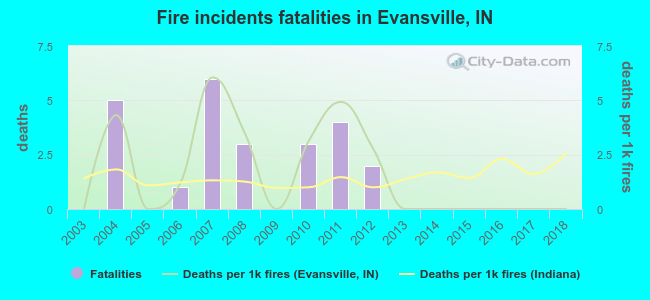 According to the data from the years 2003 - 2018 the average number of fire-related fatalities per year is 2. The highest number of reported deaths - 6 took place in 2007, and the lowest - 0 in 2003. The data has a constant trend.
The average number of deaths per 1,000 fire incidents is 2. This indicator was the highest - 6 in 2007, and the lowest 0 in 2003. The trend for fatalities per 1,000 fires is rising. Compared to the state value the number of deaths per 1,000 fire incidents is higher.
According to the data from the years 2003 - 2018 the average number of fire-related fatalities per year is 2. The highest number of reported deaths - 6 took place in 2007, and the lowest - 0 in 2003. The data has a constant trend.
The average number of deaths per 1,000 fire incidents is 2. This indicator was the highest - 6 in 2007, and the lowest 0 in 2003. The trend for fatalities per 1,000 fires is rising. Compared to the state value the number of deaths per 1,000 fire incidents is higher.Deaths per 1,000 incidents in Evansville, IN compared to nearest cities:
(Note: Based on data for all years, including only cities with at least 2,500 fire incidents)
| Evansville: | 2.6 |
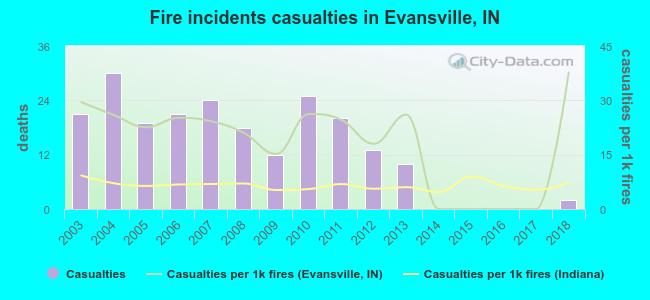 Based on the data from the years 2003 - 2018 the average number of fire-related casualties per year is 13. The highest number of reported casualties - 30 took place in 2004, and the lowest - 0 in 2014. The data has a dropping trend.
The average number of injuries per 1,000 fire incidents is 19. This indicator was the highest - 38 in 2018, and the lowest 0 in 2014. The trend for injuries per 1,000 fires is increasing. Compared to the Indiana value the number of casualties per 1,000 fires is much higher.
Based on the data from the years 2003 - 2018 the average number of fire-related casualties per year is 13. The highest number of reported casualties - 30 took place in 2004, and the lowest - 0 in 2014. The data has a dropping trend.
The average number of injuries per 1,000 fire incidents is 19. This indicator was the highest - 38 in 2018, and the lowest 0 in 2014. The trend for injuries per 1,000 fires is increasing. Compared to the Indiana value the number of casualties per 1,000 fires is much higher.Casualties per 1,000 incidents in Evansville, IN compared to nearest cities:
(Note: Based on data for all years, including only cities with at least 500 fire incidents)
| Evansville: | 23.3 |
| Newburgh: | 4.9 |
| Boonville: | 0.0 |
| Princeton: | 15.7 |
| Oakland City: | 0.0 |
| Petersburg: | 5.3 |
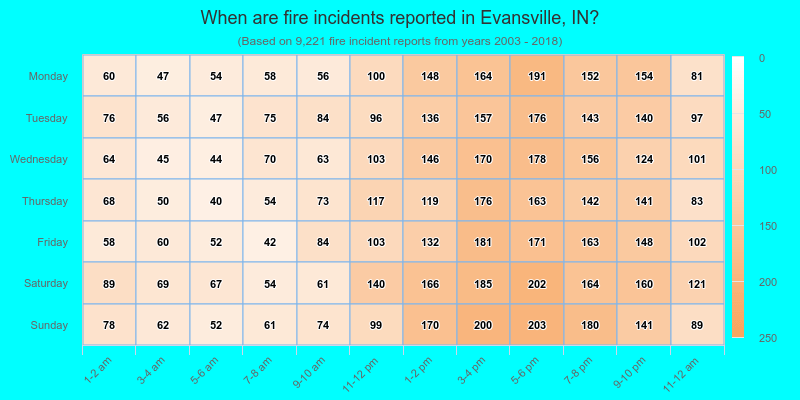
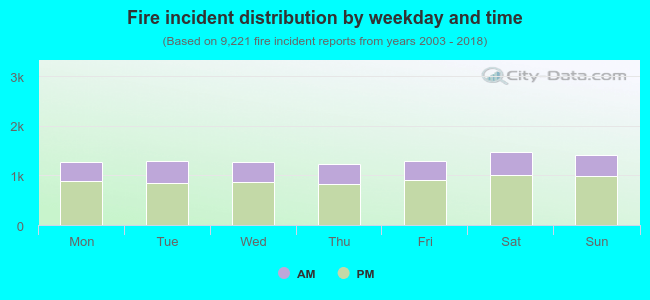 31.5% incidents where reported in the morning and 68.5% in the evening. The most fires (16.0%) took place on Saturday, and the least (13.3%) on Thursday.
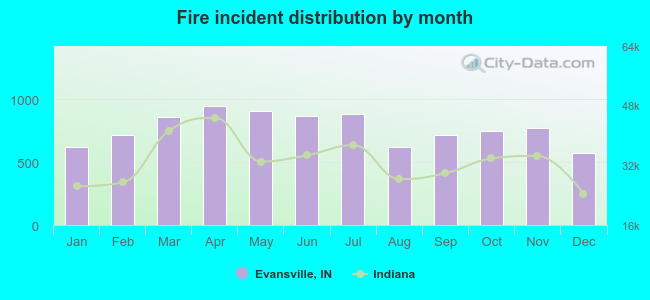 According to the 9,221 fires from years 2003 - 2018 most fires (10.3%) took place during April, and the least (6.2%) in December.
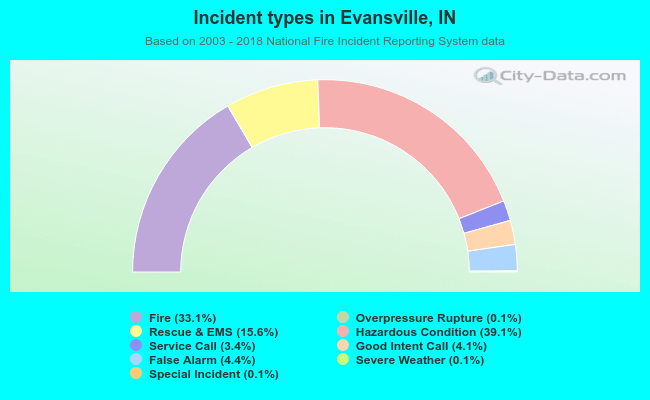 Out of all 27,823 cases reported during the years 2003 - 2018, the most belonged to the categories: Hazardous Condition (39.1%), Fire (33.1%), and Rescue & EMS (15.6%).
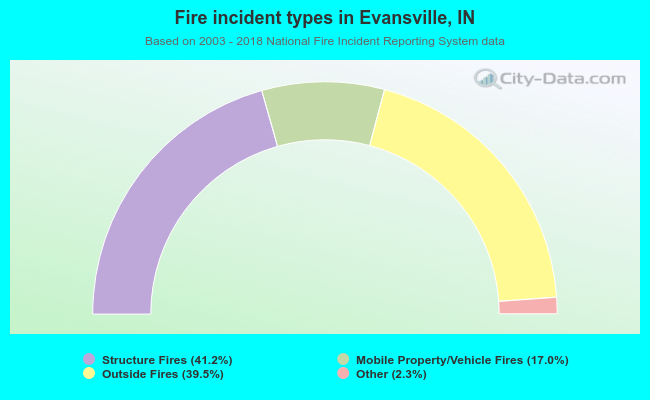 When looking into fire subcategories, the most incidents belonged to: Structure Fires (41.2%), and Outside Fires (39.5%).