Huntingburg: Fire Incidents, Indiana (IN)
Where are fire incidents reported in Huntingburg, IN
Something went wrong! Please refresh the page.
|
| |||||||||||||||||||||||||||||||||||||||||||||||||||||||||||||||||||||||||||||||||||||||||||||||||||||||||||||
2002 - 2018 National Fire Incident Reporting System (NFIRS) incidents
- Incident types reported to NFIRS in Huntingburg, IN
- 58539.0%Rescue & EMS
- 39226.1%Fire
- 22214.8%Hazardous Condition
- 1389.2%False Alarm
- 795.3%Service Call
- 634.2%Good Intent Call
- 130.9%Special Incident
- 60.4%Overpressure Rupture
- 20.1%Severe Weather
- Fire incident types reported to NFIRS in Huntingburg, IN
- 12832.7%Outside Fires
- 12431.6%Structure Fires
- 7920.2%Mobile Property/Vehicle Fires
- 6115.6%Other
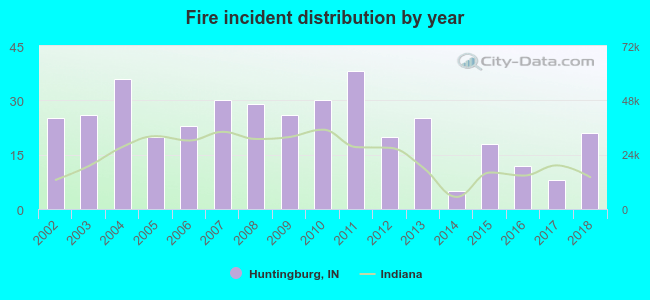 Based on the data from the years 2002 - 2018 the average number of fires per year is 23. The highest number of fire incidents - 38 took place in 2011, and the least - 5 in 2014. The data has a decreasing trend.
The average number of yearly fire incidents per 10k residents in Huntingburg, IN compared to nearest cities:
(Note: Based on data for the last 3 years, including only cities with population 5,000 and above)
| Huntingburg: | 22.6 |
| Jasper: | 16.7 |
| Boonville: | 37.9 |
| Tell City: | 23.9 |
| Washington: | 48.3 |
| Princeton: | 8.7 |
| Evansville: | 3.3 |
| Vincennes: | 35.5 |
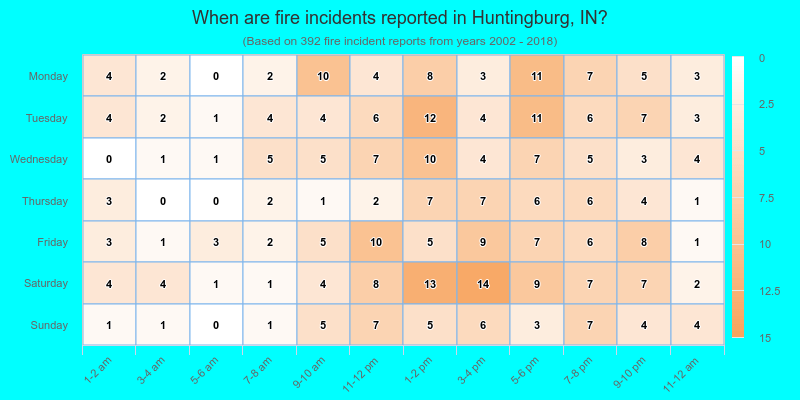
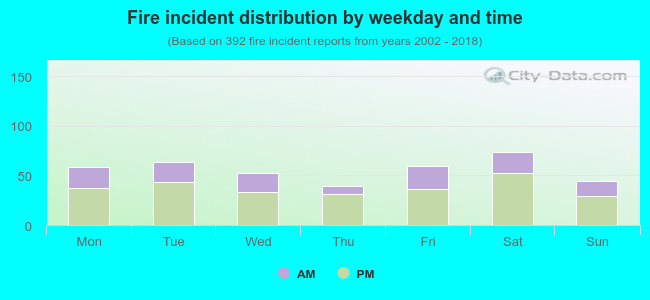 33.4% incidents where reported in the morning and 66.6% in the evening. The most fires (18.9%) took place on Saturday, and the least (9.9%) on Thursday.
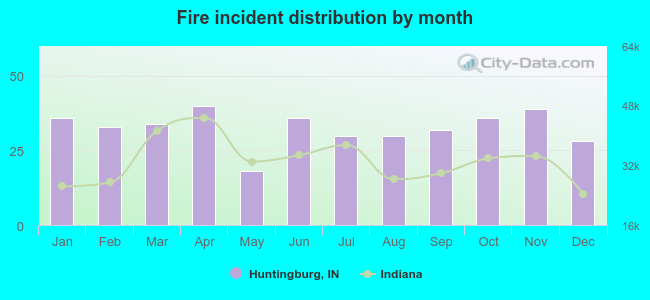 According to the 392 fires from years 2002 - 2018 most fires (10.2%) took place during April, and the least (4.6%) in May.
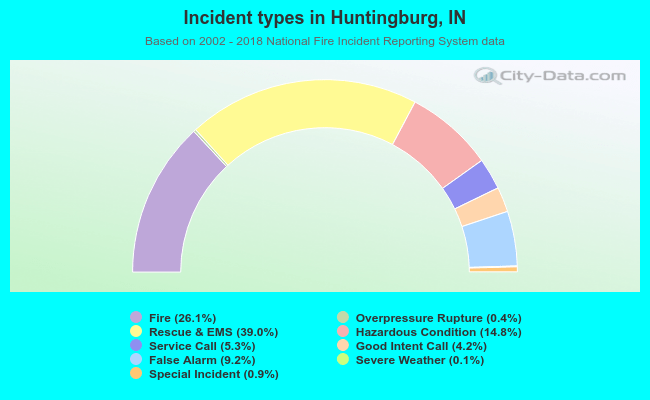 Out of all 1,500 cases reported during the years 2002 - 2018, the most belonged to the categories: Rescue & EMS (39.0%), Fire (26.1%), and Hazardous Condition (14.8%).
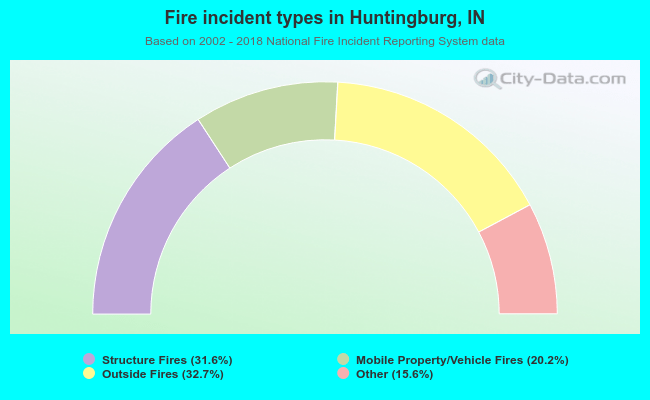 When looking into fire subcategories, the most reports belonged to: Outside Fires (32.7%), and Structure Fires (31.6%).