Ewing: Fire Incidents, New Jersey (NJ)
Where are fire incidents reported in Ewing, NJ
Something went wrong! Please refresh the page.
| Fire incidents reported | |
|---|---|
| Sreet name | Count |
| PENNINGTON RD | 360 |
| N OLDEN AVENUE EXT | 260 |
| PARKWAY AVE | 252 |
| LOWER FERRY RD | 214 |
| PARKSIDE AVE | 214 |
| OLDEN AVE | 174 |
| PROSPECT ST | 88 |
| SULLIVAN WAY | 62 |
| BRANDON AVE | 52 |
| CARLTON AVE | 52 |
| OLDEN AVENUE EXT | 52 |
| CALHOUN ST | 50 |
| UPPER FERRY RD | 48 |
| BROAD AVE | 46 |
| BUTTONWOOD DR | 46 |
| OLDEN AVE EXT | 46 |
| SPRUCE ST | 44 |
| SOMERSET ST | 42 |
| WESTERN AVE | 42 |
| ARDSLEY AVE | 40 |
| BROWNING AVE | 40 |
| PRINCETON AVE | 40 |
| SCOTCH RD | 38 |
| EWINGVILLE RD | 36 |
| SCENIC DR | 36 |
| GREEN LANE | 34 |
| HIGHGATE DR | 34 |
| HOMECREST AVE | 34 |
| ROCKLEIGH DR | 34 |
| RIVER RD | 32 |
| Other | 107 |
2004 - 2018 National Fire Incident Reporting System (NFIRS) incidents
- Incident types reported to NFIRS in Ewing, NJ
- 2,64927.7%Fire
- 2,05821.5%Hazardous Condition
- 2,02721.2%False Alarm
- 1,32513.8%Good Intent Call
- 9349.8%Rescue & EMS
- 5555.8%Service Call
- 130.1%Overpressure Rupture
- Fire incident types reported to NFIRS in Ewing, NJ
- 1,91272.2%Structure Fires
- 47317.9%Outside Fires
- 2248.5%Mobile Property/Vehicle Fires
- 401.5%Other
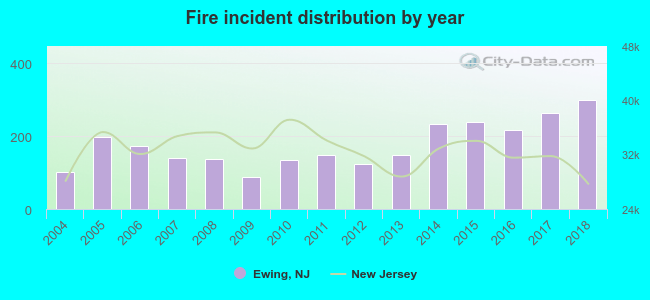 According to the data from the years 2004 - 2018 the average number of fires per year is 176. The highest number of reported fires - 298 took place in 2018, and the least - 88 in 2009. The data has a rising trend.
The average number of yearly fire incidents per 10k residents in Ewing, NJ compared to nearest cities:
(Note: Based on data for the last 3 years, including only cities with population 5,000 and above)
| Ewing: | 70.3 |
| Trenton: | 67.6 |
| Yardville: | 1.4 |
| Princeton: | 24.9 |
| Burlington: | 10.2 |
| Hightstown: | 74.8 |
| Kendall Park: | 7.1 |
| Dayton: | 16.0 |
| Franklin Park: | 26.3 |
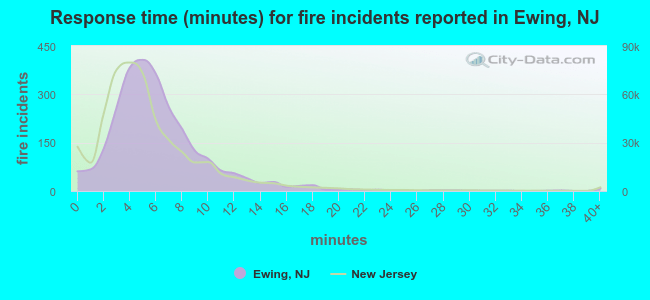 The median response time based on all reported fire incidents is 6 minutes. This is comparable to the New Jersey median value.
The median response time in Ewing, NJ compared to nearest cities:
(Note: Based on data for all years, including only cities with at least 500 fire incidents)
| Ewing: | 6 minutes |
| Trenton: | 4 minutes |
| Lawrenceville: | 7 minutes |
| Pennington: | 7 minutes |
| Bordentown: | 7 minutes |
| Hopewell: | 9 minutes |
| Princeton: | 8 minutes |
| Robbinsville: | 5 minutes |
| Florence: | 8 minutes |
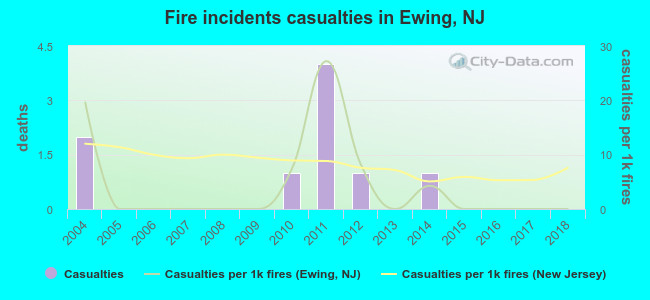 According to the data from the years 2004 - 2018 the average number of fire-related yearly casualties is 1. The highest number of reported injuries - 4 took place in 2011, and the lowest - 0 in 2005. The data has a dropping trend.
The average number of casualties per 1,000 fires is 4. This indicator was the highest - 27 in 2011, and the lowest 0 in 2005. The trend for casualties per 1,000 incidents is dropping. Compared to the New Jersey value the number of injuries per 1,000 incidents is much lower.
According to the data from the years 2004 - 2018 the average number of fire-related yearly casualties is 1. The highest number of reported injuries - 4 took place in 2011, and the lowest - 0 in 2005. The data has a dropping trend.
The average number of casualties per 1,000 fires is 4. This indicator was the highest - 27 in 2011, and the lowest 0 in 2005. The trend for casualties per 1,000 incidents is dropping. Compared to the New Jersey value the number of injuries per 1,000 incidents is much lower.Casualties per 1,000 incidents in Ewing, NJ compared to nearest cities:
(Note: Based on data for all years, including only cities with at least 500 fire incidents)
| Ewing: | 3.4 |
| Trenton: | 9.2 |
| Lawrenceville: | 9.6 |
| Pennington: | 2.9 |
| Bordentown: | 0.0 |
| Hopewell: | 6.6 |
| Princeton: | 9.0 |
| Robbinsville: | 3.1 |
| Florence: | 9.5 |
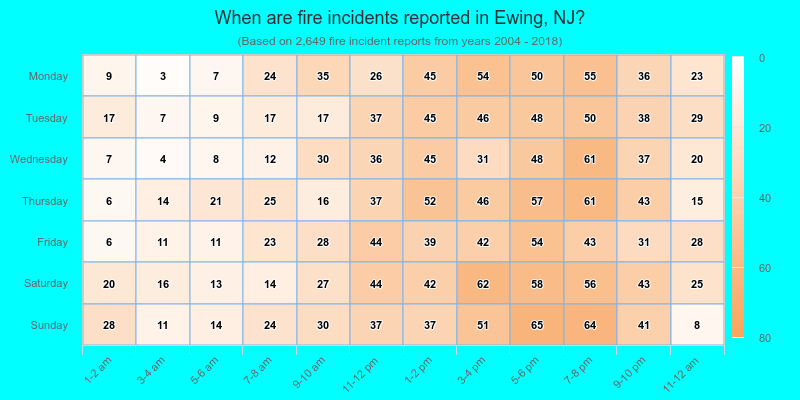
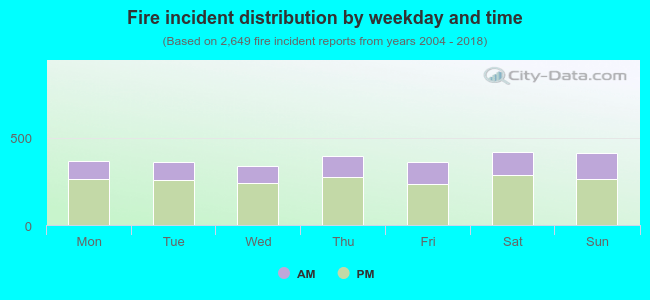 31.1% incidents where reported in the morning and 68.9% in the evening. The most fires (15.9%) took place on Saturday, and the least (12.8%) on Wednesday.
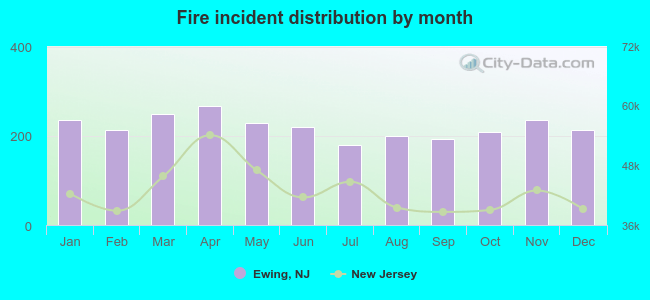 According to the 2,649 fire incidents from years 2004 - 2018 most fires (10.1%) took place during April, and the least (6.8%) in July.
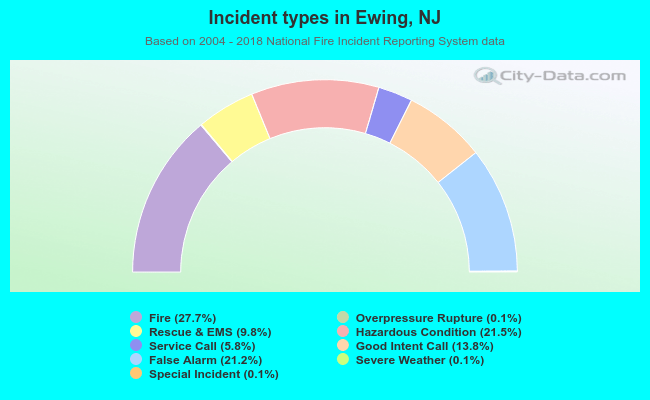 Out of all 9,572 cases reported during the years 2004 - 2018, the most belonged to the categories: Fire (27.7%), Hazardous Condition (21.5%), and False Alarm (21.2%).
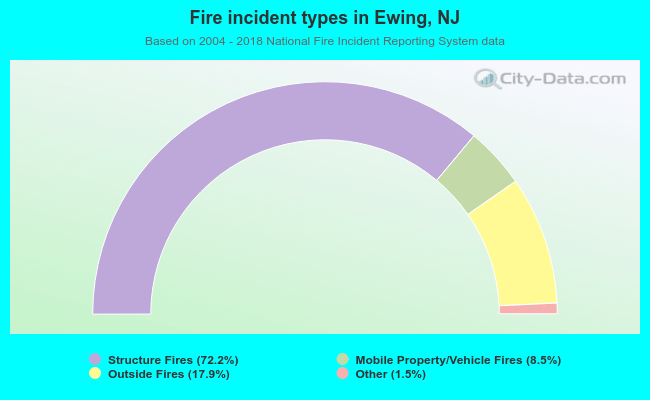 When looking into fire subcategories, the most incidents belonged to: Structure Fires (72.2%), and Outside Fires (17.9%).