Fairborn: Fire Incidents, Ohio (OH)
Where are fire incidents reported in Fairborn, OH
Something went wrong! Please refresh the page.
| Fire incidents reported | |
|---|---|
| Sreet name | Count |
| BROAD ST | 140 |
| DAY-YELL SPGS RD | 138 |
| FOREST LN | 104 |
| DAYTON YELLOW SPRINGS RD | 94 |
| COL GLENN HWY | 64 |
| COLONEL GLENN HWY | 58 |
| XENIA DR | 50 |
| DUNCAN DR | 46 |
| CENTRAL AVE | 42 |
| FOREST ST | 42 |
| I 675 | 42 |
| MAPLE AV | 42 |
| ORVILLE ST | 42 |
| FUNDERBURG RD | 40 |
| DAYTON DR | 38 |
| BEAVER VALLEY RD | 36 |
| IRONWOOD DR | 36 |
| MAPLE AVE | 36 |
| BEAVERCREEK MUTUAL AID | 34 |
| PRESIDENTIAL DR | 34 |
| KAUFFMAN AVE | 32 |
| MADISON ST | 32 |
| OLD YELLOW SPRINGS RD | 30 |
| I-675 NB | 28 |
| KAUFFMAN AV | 28 |
| MARCHMONT DR | 28 |
| WALLACE DR | 28 |
| WAYNE DR | 28 |
| ZINK RD | 28 |
| RIVERSIDE MUTUAL AID | 26 |
| Other | 472 |
2003 - 2018 National Fire Incident Reporting System (NFIRS) incidents
- Incident types reported to NFIRS in Fairborn, OH
- 17,14061.5%Rescue & EMS
- 2,91910.5%Hazardous Condition
- 2,91310.5%Service Call
- 1,9186.9%Fire
- 1,4875.3%Good Intent Call
- 1,4075.1%False Alarm
- 420.2%Overpressure Rupture
- Fire incident types reported to NFIRS in Fairborn, OH
- 86345.0%Structure Fires
- 72838.0%Outside Fires
- 31816.6%Mobile Property/Vehicle Fires
- 90.5%Other
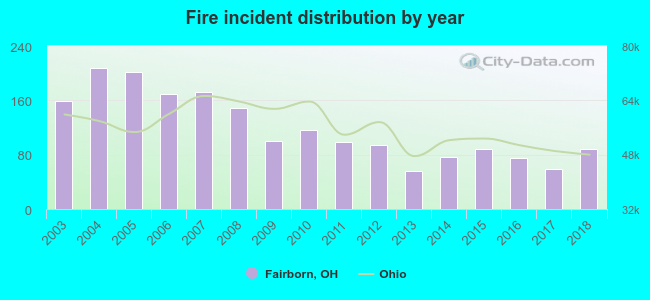 Based on the data from the years 2003 - 2018 the average number of fires per year is 120. The highest number of reported fires - 207 took place in 2004, and the least - 56 in 2013. The data has a declining trend.
The average number of yearly fire incidents per 10k residents in Fairborn, OH compared to nearest cities:
(Note: Based on data for the last 3 years, including only cities with population 5,000 and above)
| Fairborn: | 22.3 |
| Riverside: | 20.2 |
| Beavercreek: | 4.4 |
| Huber Heights: | 30.3 |
| New Carlisle: | 93.9 |
| Xenia: | 40.1 |
| Dayton: | 44.3 |
| Oakwood: | 46.2 |
| Kettering: | 14.8 |
 The median response time based on all reported fire incidents is 6 minutes. This is similar to the Ohio median value.
The median response time in Fairborn, OH compared to nearest cities:
(Note: Based on data for all years, including only cities with at least 500 fire incidents)
| Fairborn: | 6 minutes |
| Riverside: | 6 minutes |
| Beavercreek: | 6 minutes |
| Huber Heights: | 6 minutes |
| New Carlisle: | 8 minutes |
| Xenia: | 6 minutes |
| Dayton: | 5 minutes |
| Oakwood: | 5 minutes |
| Kettering: | 6 minutes |
 Based on the data from the years 2003 - 2018 the average number of fire-related fatalities per year is 0. The highest number of deaths - 2 took place in 2007, and the lowest - 0 in 2003. The data has a growing trend.
 According to the data from the years 2003 - 2018 the average number of fire-related casualties per year is 3. The highest number of reported casualties - 11 took place in 2011, and the lowest - 0 in 2012. The data has a declining trend.
The average number of casualties per 1,000 fire incidents is 25. This indicator was the highest - 111 in 2011, and the lowest 0 in 2012. The trend for injuries per 1,000 fire incidents is decreasing. Compared to the state value the number of injuries per 1,000 fires is higher.
According to the data from the years 2003 - 2018 the average number of fire-related casualties per year is 3. The highest number of reported casualties - 11 took place in 2011, and the lowest - 0 in 2012. The data has a declining trend.
The average number of casualties per 1,000 fire incidents is 25. This indicator was the highest - 111 in 2011, and the lowest 0 in 2012. The trend for injuries per 1,000 fire incidents is decreasing. Compared to the state value the number of injuries per 1,000 fires is higher.Casualties per 1,000 incidents in Fairborn, OH compared to nearest cities:
(Note: Based on data for all years, including only cities with at least 500 fire incidents)
| Fairborn: | 27.6 |
| Riverside: | 19.3 |
| Beavercreek: | 36.2 |
| Huber Heights: | 35.6 |
| New Carlisle: | 4.3 |
| Xenia: | 24.3 |
| Dayton: | 20.5 |
| Oakwood: | 2.1 |
| Kettering: | 25.7 |
 31.2% incidents where reported in the morning and 68.8% in the evening. The most fires (15.4%) took place on Friday, and the least (12.1%) on Tuesday.
 According to the 1,918 fires from years 2003 - 2018 most fires (10.1%) took place during May, and the least (6.4%) in February.
 Out of all 27,857 cases reported during the years 2003 - 2018, the most belonged to the categories: Rescue & EMS (61.5%), Hazardous Condition (10.5%), and Service Call (10.5%).
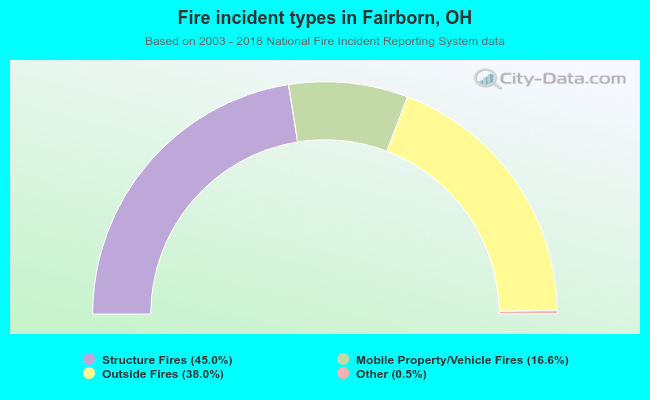 When looking into fire subcategories, the most reports belonged to: Structure Fires (45.0%), and Outside Fires (38.0%).