Fairfield: Fire Incidents, New Jersey (NJ)
Where are fire incidents reported in Fairfield, NJ
Something went wrong! Please refresh the page.
|
| |||||||||||||||||||||||||||||||||||||||||||||||||||||||||||||||||||||||||||||||||||||||||||||||||||||||||||||
2003 - 2018 National Fire Incident Reporting System (NFIRS) incidents
- Incident types reported to NFIRS in Fairfield, NJ
- 1,07034.6%Hazardous Condition
- 94230.5%False Alarm
- 72523.5%Fire
- 1565.1%Good Intent Call
- 1153.7%Service Call
- 702.3%Rescue & EMS
- 60.2%Special Incident
- Fire incident types reported to NFIRS in Fairfield, NJ
- 32645.0%Structure Fires
- 20027.6%Outside Fires
- 18525.5%Mobile Property/Vehicle Fires
- 141.9%Other
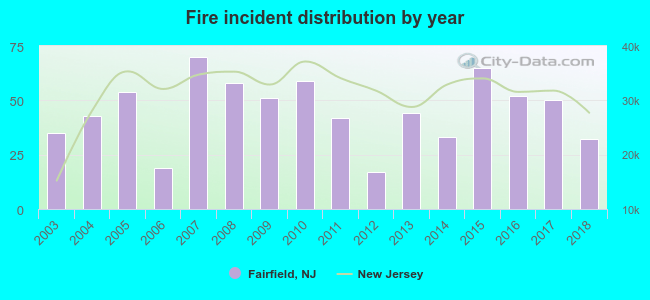 Based on the data from the years 2003 - 2018 the average number of fire incidents per year is 45. The highest number of fires - 70 took place in 2007, and the least - 17 in 2012. The data has a declining trend.
The average number of yearly fire incidents per 10k residents in Fairfield, NJ compared to nearest cities:
(Note: Based on data for the last 3 years, including only cities with population 5,000 and above)
| Fairfield: | 65.1 |
| North Caldwell: | 9.3 |
| West Caldwell: | 32.1 |
| Caldwell: | 18.1 |
| Lincoln Park: | 7.6 |
| Little Falls: | 65.6 |
| Cedar Grove: | 13.1 |
| Roseland: | 34.3 |
| Verona: | 1.9 |
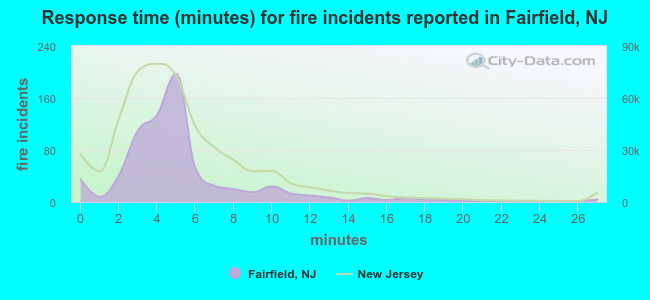 The median response time based on all reported fire incidents is 5 minutes. This is comparable to the New Jersey median value.
The median response time in Fairfield, NJ compared to nearest cities:
(Note: Based on data for all years, including only cities with at least 500 fire incidents)
| Fairfield: | 5 minutes |
| West Caldwell: | 3 minutes |
| Little Falls: | 4 minutes |
| Totowa: | 3 minutes |
| Wayne: | 5 minutes |
| Montclair: | 3 minutes |
| Livingston: | 0 minutes |
| West Orange: | 5 minutes |
| Paterson: | 4 minutes |
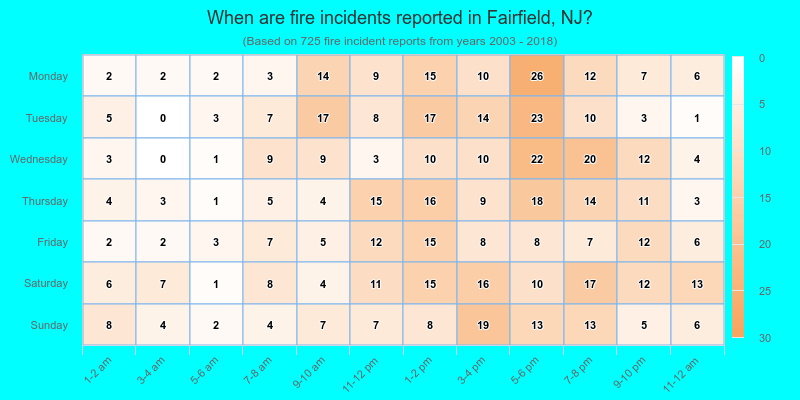
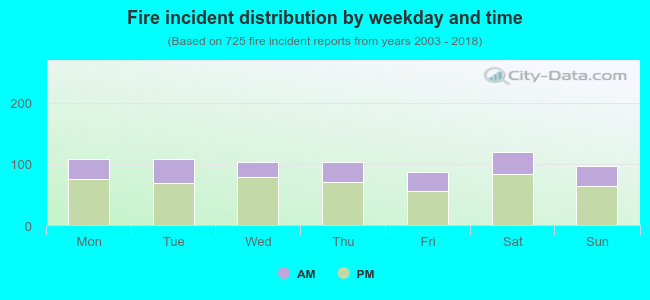 31.6% incidents where reported in the morning and 68.4% in the evening. The most fires (16.6%) took place on Saturday, and the least (12.0%) on Friday.
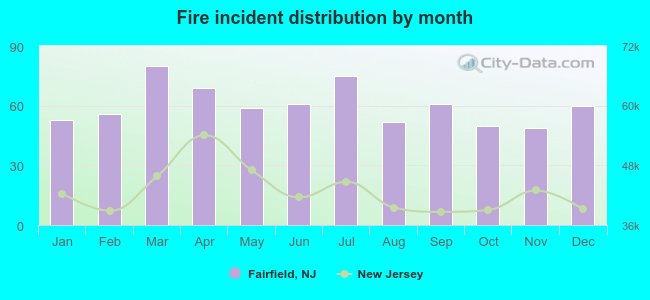 According to the 725 reports from years 2003 - 2018 most fires (11.0%) took place during March, and the least (6.8%) in November.
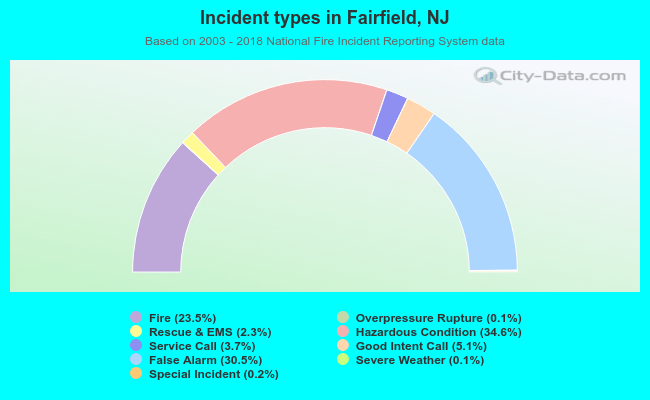 Out of all 3,089 cases reported during the years 2003 - 2018, the most belonged to the categories: Hazardous Condition (34.6%), False Alarm (30.5%), and Fire (23.5%).
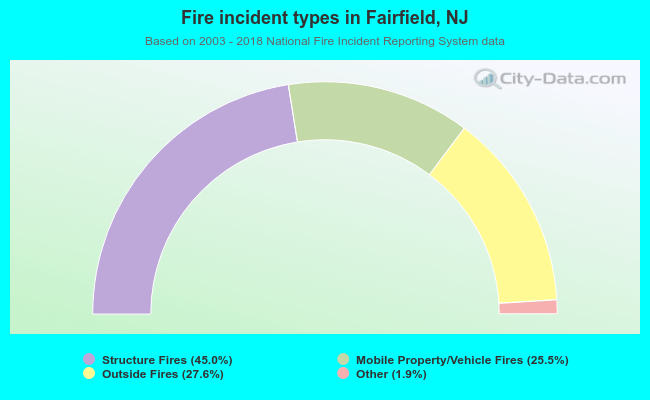 When looking into fire subcategories, the most incidents belonged to: Structure Fires (45.0%), and Outside Fires (27.6%).