Little Falls: Fire Incidents, New Jersey (NJ)
Where are fire incidents reported in Little Falls, NJ
Something went wrong! Please refresh the page.
| Fire incidents reported | |
|---|---|
| Sreet name | Count |
| MSU | 1,908 |
| MAIN ST | 296 |
| TULIP CRES | 78 |
| LONGHILL RD | 74 |
| CLOVE RD | 60 |
| 46 RT | 50 |
| 23 RT | 36 |
| PATERSON AVE | 30 |
| NOTCH PARK RD | 20 |
| ZELIFF AVE | 20 |
| LOWER NOTCH RD | 18 |
| MUTUIAL AID- PATERSON | 18 |
| BROWERTOWN RD | 16 |
| RUSTIC RDG | 16 |
| CEDAR GROVE RD | 14 |
| MORNINGSIDE CIR | 14 |
| OVERLOOK AVE | 14 |
| SINDLE AVE | 12 |
| MUTUIAL AID- CLIFTON | 10 |
| ORCHARD ST | 10 |
| WILMORE RD | 10 |
| HOUSTON RD | 8 |
| KINGWOOD DR | 8 |
| LINCOLN AVE | 8 |
| LOUIS ST | 8 |
| NOTCH RD | 8 |
| SECOND AVE | 8 |
| SHADY LN | 8 |
| TURNBERRY RD | 8 |
| WILLIAM ST | 8 |
2005 - 2018 National Fire Incident Reporting System (NFIRS) incidents
- Incident types reported to NFIRS in Little Falls, NJ
- 1,52539.9%Fire
- 95725.0%Hazardous Condition
- 77520.3%False Alarm
- 2326.1%Rescue & EMS
- 1654.3%Good Intent Call
- 1473.8%Service Call
- 140.4%Overpressure Rupture
- 70.2%Special Incident
- Fire incident types reported to NFIRS in Little Falls, NJ
- 1,35789.0%Structure Fires
- 1459.5%Outside Fires
- 211.4%Mobile Property/Vehicle Fires
- 20.1%Other
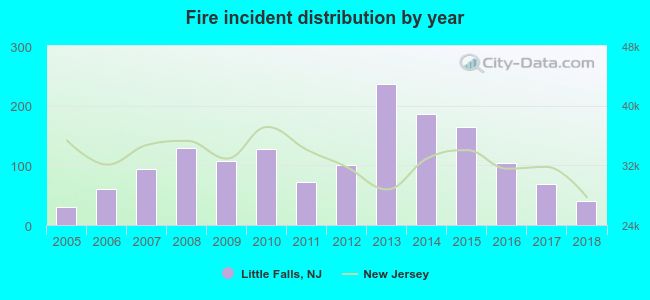 Based on the data from the years 2005 - 2018 the average number of fire incidents per year is 109. The highest number of fires - 237 took place in 2013, and the least - 31 in 2005. The data has a growing trend.
The average number of yearly fire incidents per 10k residents in Little Falls, NJ compared to nearest cities:
(Note: Based on data for the last 3 years, including only cities with population 5,000 and above)
| Little Falls: | 65.6 |
| Cedar Grove: | 13.1 |
| Totowa: | 76.8 |
| West Paterson: | 0.9 |
| North Caldwell: | 9.3 |
| Upper Montclair: | 11.2 |
| Verona: | 1.9 |
| Fairfield: | 65.1 |
| Caldwell: | 18.1 |
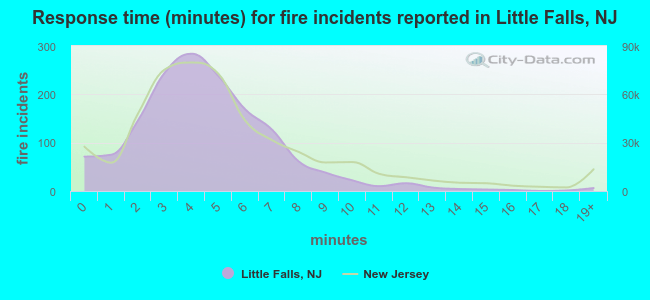 The median response time based on all reported fire incidents is 4 minutes. This is lower than the New Jersey median value.
The median response time in Little Falls, NJ compared to nearest cities:
(Note: Based on data for all years, including only cities with at least 500 fire incidents)
| Little Falls: | 4 minutes |
| Totowa: | 3 minutes |
| Fairfield: | 5 minutes |
| West Caldwell: | 3 minutes |
| Clifton: | 5 minutes |
| Montclair: | 3 minutes |
| Paterson: | 4 minutes |
| Wayne: | 5 minutes |
| Passaic: | 4 minutes |
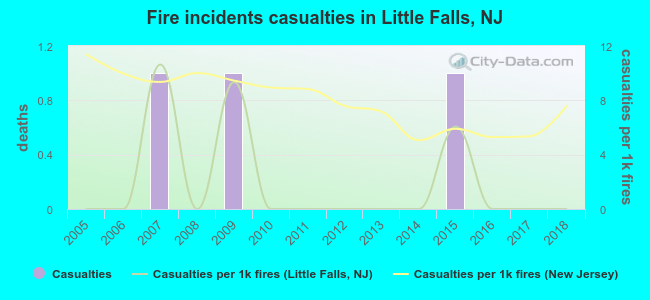 Based on the data from the years 2005 - 2018 the average number of fire-related yearly casualties is 0. The highest number of casualties - 1 took place in 2007, and the lowest - 0 in 2005. The data has a constant trend.
The average number of casualties per 1,000 fires is 2. This indicator was the highest - 11 in 2007, and the lowest 0 in 2005. The trend for injuries per 1,000 fires is constant. Compared to the state value the number of casualties per 1,000 incidents is much lower.
Based on the data from the years 2005 - 2018 the average number of fire-related yearly casualties is 0. The highest number of casualties - 1 took place in 2007, and the lowest - 0 in 2005. The data has a constant trend.
The average number of casualties per 1,000 fires is 2. This indicator was the highest - 11 in 2007, and the lowest 0 in 2005. The trend for injuries per 1,000 fires is constant. Compared to the state value the number of casualties per 1,000 incidents is much lower.
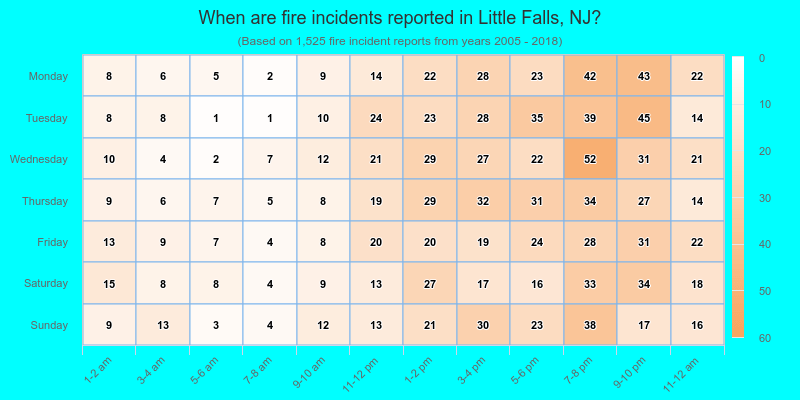
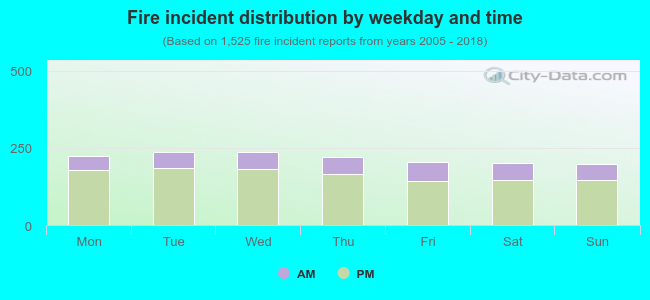 24.8% incidents where reported in the morning and 75.2% in the evening. The most fires (15.6%) took place on Wednesday, and the least (13.0%) on Sunday.
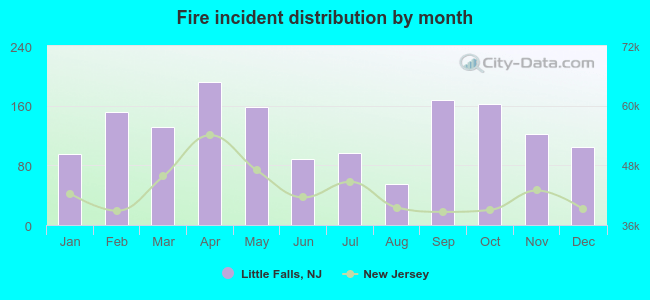 According to the 1,525 fires from years 2005 - 2018 most fires (12.6%) took place during April, and the least (3.6%) in August.
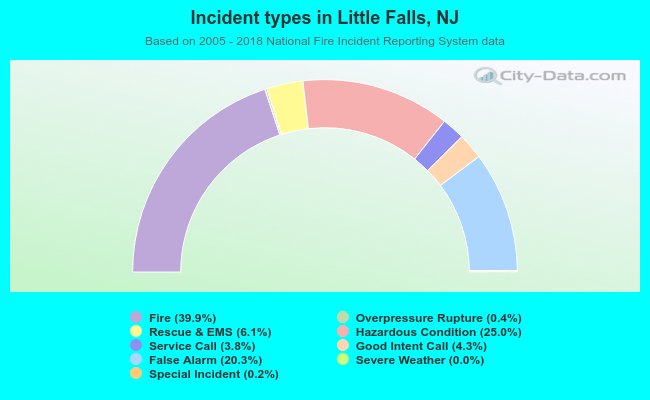 Out of all 3,823 cases reported during the years 2005 - 2018, the most belonged to the categories: Fire (39.9%), Hazardous Condition (25.0%), and False Alarm (20.3%).
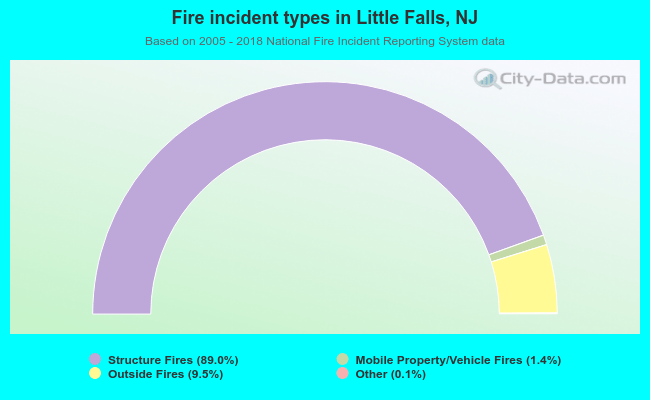 When looking into fire subcategories, the most reports belonged to: Structure Fires (89.0%), and Outside Fires (9.5%).