Farmingdale: Fire Incidents, New York (NY)
Where are fire incidents reported in Farmingdale, NY
Something went wrong! Please refresh the page.
|
| |||||||||||||||||||||||||||||||||||||||||||||||||||||||||||||||||||||||||||||||||||||||||||||||||||||||||||||
2005 - 2018 National Fire Incident Reporting System (NFIRS) incidents
- Incident types reported to NFIRS in Farmingdale, NY
- 3,84956.8%Rescue & EMS
- 95014.0%False Alarm
- 77711.5%Hazardous Condition
- 6079.0%Good Intent Call
- 3825.6%Fire
- 1972.9%Service Call
- 140.2%Overpressure Rupture
- Fire incident types reported to NFIRS in Farmingdale, NY
- 15941.6%Outside Fires
- 15440.3%Structure Fires
- 4110.7%Mobile Property/Vehicle Fires
- 287.3%Other
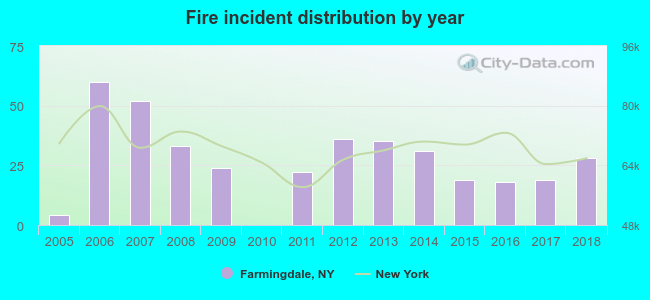 Based on the data from the years 2005 - 2018 the average number of fires per year is 27. The highest number of fires - 60 took place in 2006, and the least - 0 in 2010. The data has a rising trend.
The average number of yearly fire incidents per 10k residents in Farmingdale, NY compared to nearest cities:
(Note: Based on data for the last 3 years, including only cities with population 5,000 and above)
| Farmingdale: | 25.1 |
| South Farmingdale: | 6.7 |
| East Farmingdale: | 7.7 |
| Old Bethpage: | 3.0 |
| Bethpage: | 13.2 |
| North Massapequa: | 2.1 |
| North Amityville: | 1.5 |
| Massapequa Park: | 17.4 |
| Levittown: | 5.2 |
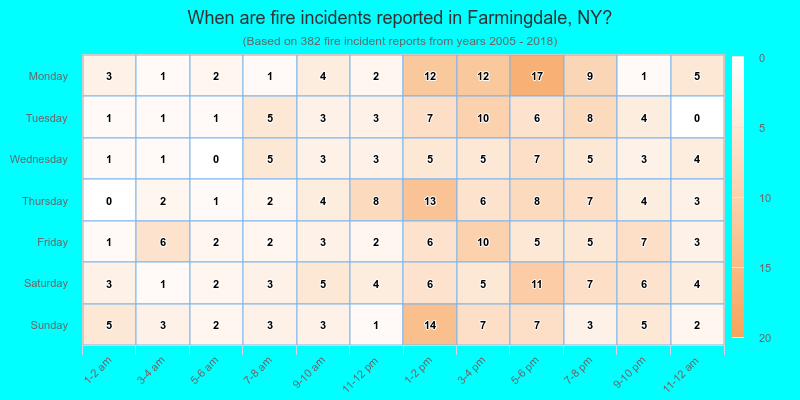
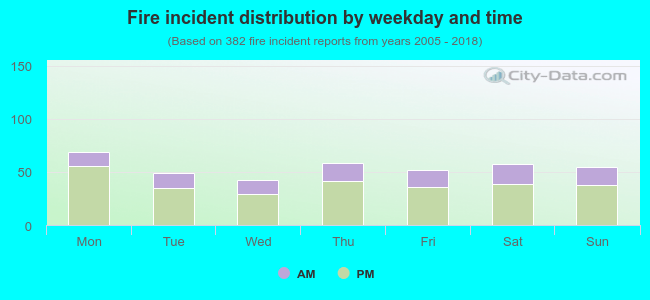 28.3% incidents where reported in the morning and 71.7% in the evening. The most fires (18.1%) took place on Monday, and the least (11.0%) on Wednesday.
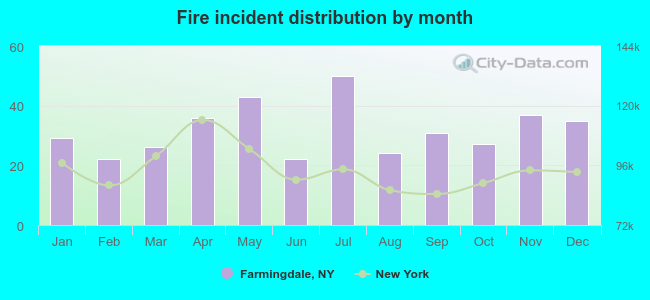 Based on the 382 fire incidents from years 2005 - 2018 most fires (13.1%) took place during July, and the least (5.8%) in February.
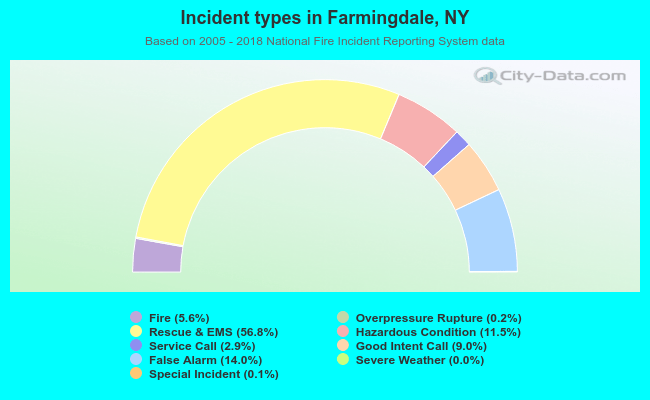 Out of all 6,781 cases reported during the years 2005 - 2018, the most belonged to the categories: Rescue & EMS (56.8%), False Alarm (14.0%), and Hazardous Condition (11.5%).
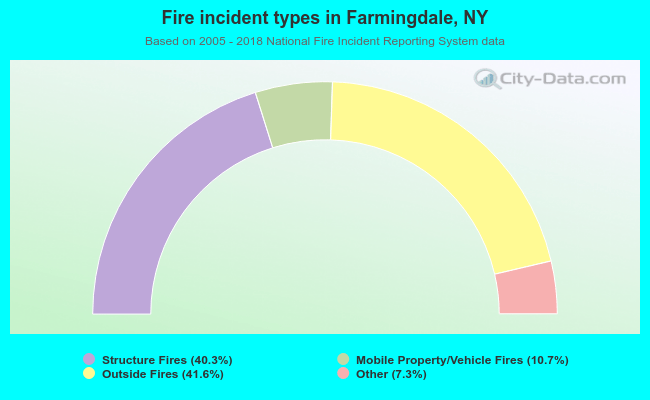 When looking into fire subcategories, the most reports belonged to: Outside Fires (41.6%), and Structure Fires (40.3%).