Massapequa Park: Fire Incidents, New York (NY)
Where are fire incidents reported in Massapequa Park, NY
Something went wrong! Please refresh the page.
|
| |||||||||||||||||||||||||||||||||||||||||||||||||||||||||||||||||||||||||||||||||||||||||||||||||||||||||||||
2005 - 2018 National Fire Incident Reporting System (NFIRS) incidents
- Incident types reported to NFIRS in Massapequa Park, NY
- 2,00345.9%Rescue & EMS
- 1,00623.0%Hazardous Condition
- 57613.2%False Alarm
- 48011.0%Fire
- 2164.9%Good Intent Call
- 801.8%Service Call
- Fire incident types reported to NFIRS in Massapequa Park, NY
- 26855.8%Structure Fires
- 18338.1%Outside Fires
- 255.2%Mobile Property/Vehicle Fires
- 40.8%Other
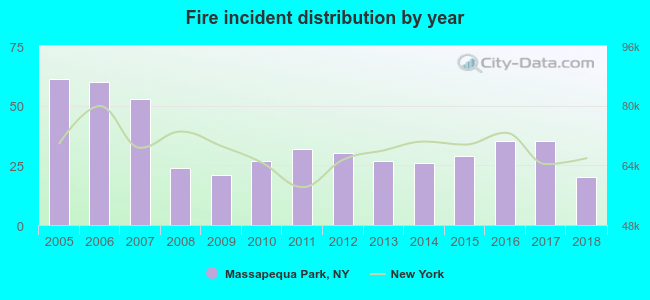 Based on the data from the years 2005 - 2018 the average number of fire incidents per year is 34. The highest number of reported fire incidents - 61 took place in 2005, and the least - 20 in 2018. The data has a declining trend.
The average number of yearly fire incidents per 10k residents in Massapequa Park, NY compared to nearest cities:
(Note: Based on data for the last 3 years, including only cities with population 5,000 and above)
| Massapequa Park: | 17.4 |
| East Massapequa: | 1.6 |
| Massapequa: | 22.9 |
| North Massapequa: | 2.1 |
| Amityville: | 42.0 |
| North Amityville: | 1.5 |
| South Farmingdale: | 6.7 |
| Seaford: | 3.3 |
| Copiague: | 5.7 |
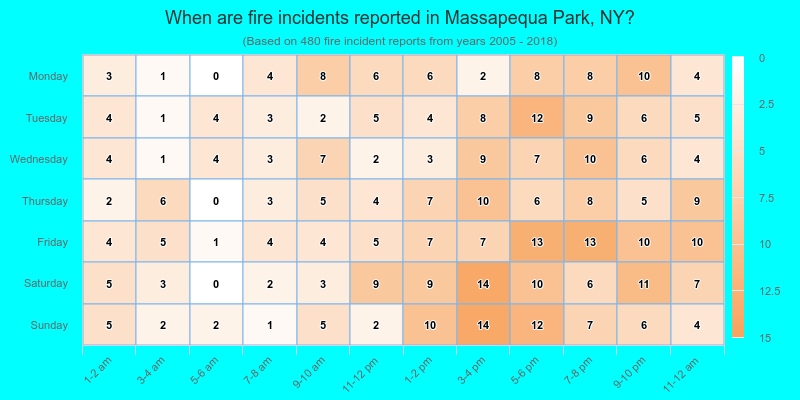
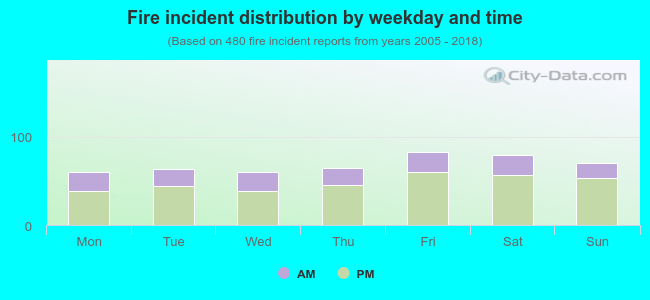 30.0% incidents where reported in the morning and 70.0% in the evening. The most fires (17.3%) took place on Friday, and the least (12.5%) on Monday.
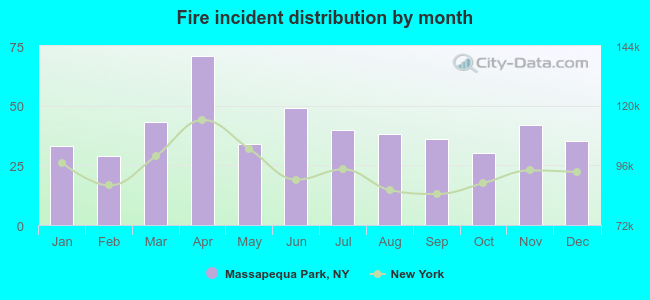 According to the 480 incident reports from years 2005 - 2018 most fires (14.8%) took place during April, and the least (6.0%) in February.
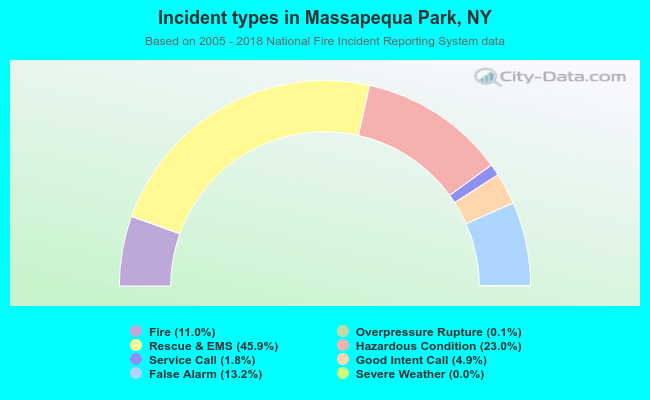 Out of all 4,365 cases reported during the years 2005 - 2018, the most belonged to the categories: Rescue & EMS (45.9%), Hazardous Condition (23.0%), and False Alarm (13.2%).
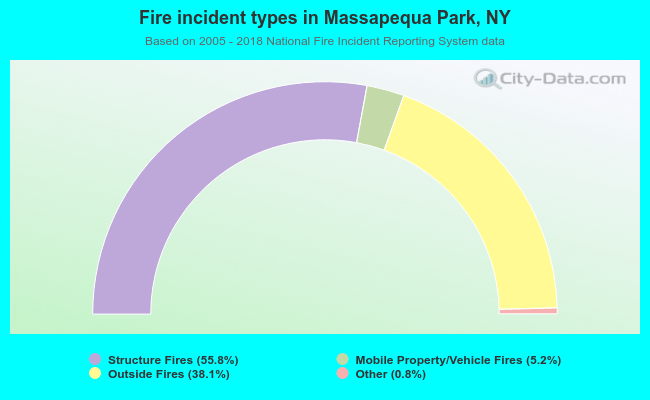 When looking into fire subcategories, the most reports belonged to: Structure Fires (55.8%), and Outside Fires (38.1%).