Fayetteville: Fire Incidents, Arkansas (AR)
Where are fire incidents reported in Fayetteville, AR
Something went wrong! Please refresh the page.
| Fire incidents reported | |
|---|---|
| Sreet name | Count |
| COLLEGE AVE | 288 |
| SCHOOL AVE | 190 |
| I540 | 152 |
| LEVERETT AVE | 150 |
| WEDINGTON DR | 140 |
| CROSSOVER RD | 138 |
| MARTIN LUTHER KING BLVD | 128 |
| GARLAND AVE | 122 |
| GREGG AVE | 116 |
| HIGHWAY 16 | 108 |
| SHILOH DR | 106 |
| HUNTSVILLE RD | 100 |
| SIXTH | 90 |
| HARMON | 84 |
| HWY 16 | 72 |
| FIFTEENTH | 70 |
| BETTY JO DR | 68 |
| DOUBLE SPRINGS | 66 |
| DOUBLE SPRINGS RD | 66 |
| JOYCE BLVD | 66 |
| MISSION BLVD | 66 |
| ZION RD | 64 |
| DICKSON | 60 |
| SYCAMORE | 58 |
| CATO SPRINGS RD | 56 |
| DUNCAN AVE | 52 |
| TOWNSHIP | 52 |
| SALEM | 50 |
| BORICK DR | 48 |
| MAPLE | 46 |
| Other | 2,801 |
2002 - 2018 National Fire Incident Reporting System (NFIRS) incidents
- Incident types reported to NFIRS in Fayetteville, AR
- 35,61755.5%Rescue & EMS
- 10,87816.9%Good Intent Call
- 5,6738.8%Fire
- 4,1946.5%Hazardous Condition
- 3,7425.8%Service Call
- 3,7425.8%False Alarm
- 2640.4%Special Incident
- Fire incident types reported to NFIRS in Fayetteville, AR
- 2,56145.1%Outside Fires
- 2,24439.6%Structure Fires
- 76613.5%Mobile Property/Vehicle Fires
- 1021.8%Other
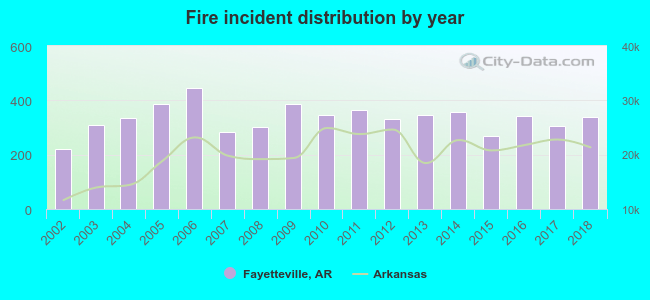 Based on the data from the years 2002 - 2018 the average number of fire incidents per year is 334. The highest number of reported fire incidents - 445 took place in 2006, and the least - 221 in 2002. The data has a rising trend.
The average number of yearly fire incidents per 10k residents in Fayetteville, AR compared to nearest cities:
(Note: Based on data for the last 3 years, including only cities with population 5,000 and above)
| Fayetteville: | 40.9 |
| Farmington: | 87.0 |
| Springdale: | 34.6 |
| Lowell: | 81.2 |
| Rogers: | 34.1 |
| Bentonville: | 36.0 |
| Centerton: | 41.7 |
| Siloam Springs: | 56.9 |
| Pea Ridge: | 27.4 |
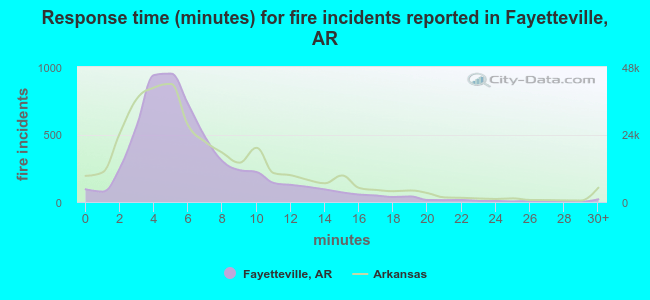 The median response time based on all reported fire incidents is 5 minutes. This is lower than the state median value.
The median response time in Fayetteville, AR compared to nearest cities:
(Note: Based on data for all years, including only cities with at least 500 fire incidents)
| Fayetteville: | 5 minutes |
| Farmington: | 6 minutes |
| Springdale: | 5 minutes |
| Elkins: | 8 minutes |
| Prairie Grove: | 9 minutes |
| Lowell: | 5 minutes |
| Lincoln: | 10 minutes |
| Rogers: | 6 minutes |
| Bentonville: | 5 minutes |
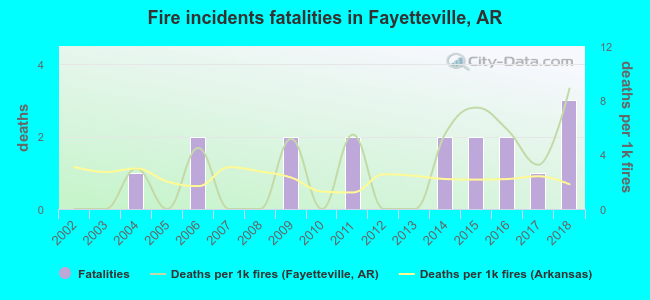 According to the data from the years 2002 - 2018 the average number of fire-related fatalities per year is 1. The highest number of reported deaths - 3 took place in 2018, and the lowest - 0 in 2002. The data has a growing trend.
The average number of deaths per 1,000 fire incidents is 3. This indicator was the highest - 9 in 2018, and the lowest 0 in 2002. The trend for fatalities per 1,000 fires is growing. Compared to the state value the number of fatalities per 1,000 fires is higher.
According to the data from the years 2002 - 2018 the average number of fire-related fatalities per year is 1. The highest number of reported deaths - 3 took place in 2018, and the lowest - 0 in 2002. The data has a growing trend.
The average number of deaths per 1,000 fire incidents is 3. This indicator was the highest - 9 in 2018, and the lowest 0 in 2002. The trend for fatalities per 1,000 fires is growing. Compared to the state value the number of fatalities per 1,000 fires is higher.Deaths per 1,000 incidents in Fayetteville, AR compared to nearest cities:
(Note: Based on data for all years, including only cities with at least 2,500 fire incidents)
| Fayetteville: | 3.0 |
| Springdale: | 0.9 |
| Rogers: | 2.2 |
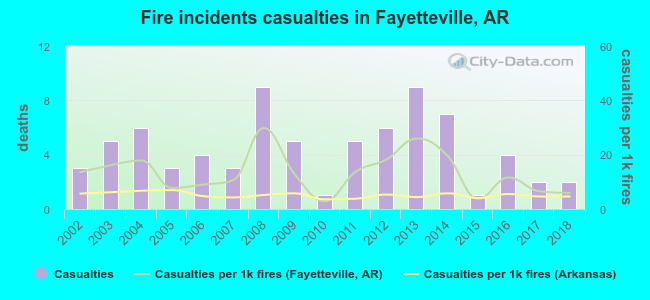 Based on the reports from the years 2002 - 2018 the average number of fire-related yearly casualties is 4. The highest number of injuries - 9 took place in 2008, and the lowest - 1 in 2010. The data has a dropping trend.
The average number of casualties per 1,000 fires is 13. This indicator was the highest - 30 in 2008, and the lowest 3 in 2010. The trend for injuries per 1,000 incidents is dropping. Compared to the state value the number of casualties per 1,000 fires is much higher.
Based on the reports from the years 2002 - 2018 the average number of fire-related yearly casualties is 4. The highest number of injuries - 9 took place in 2008, and the lowest - 1 in 2010. The data has a dropping trend.
The average number of casualties per 1,000 fires is 13. This indicator was the highest - 30 in 2008, and the lowest 3 in 2010. The trend for injuries per 1,000 incidents is dropping. Compared to the state value the number of casualties per 1,000 fires is much higher.Casualties per 1,000 incidents in Fayetteville, AR compared to nearest cities:
(Note: Based on data for all years, including only cities with at least 500 fire incidents)
| Fayetteville: | 13.2 |
| Farmington: | 4.5 |
| Springdale: | 17.8 |
| Elkins: | 0.0 |
| Prairie Grove: | 1.8 |
| Lowell: | 1.3 |
| Lincoln: | 0.0 |
| Rogers: | 9.7 |
| Bentonville: | 8.7 |
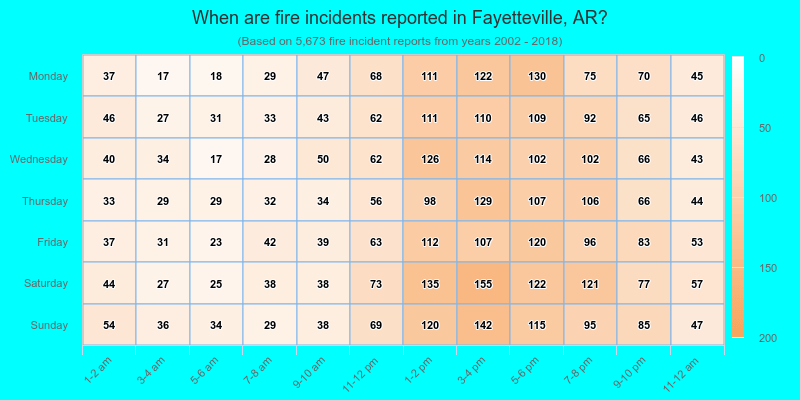
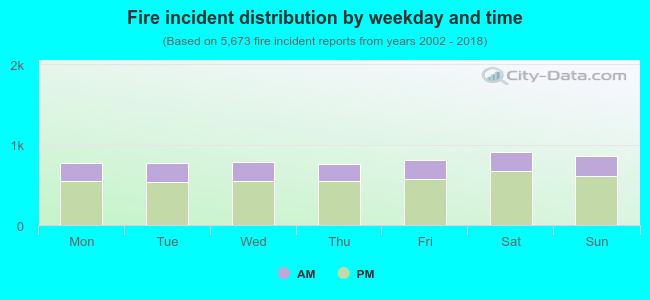 28.9% incidents where reported in the morning and 71.1% in the evening. The most fires (16.1%) took place on Saturday, and the least (13.4%) on Thursday.
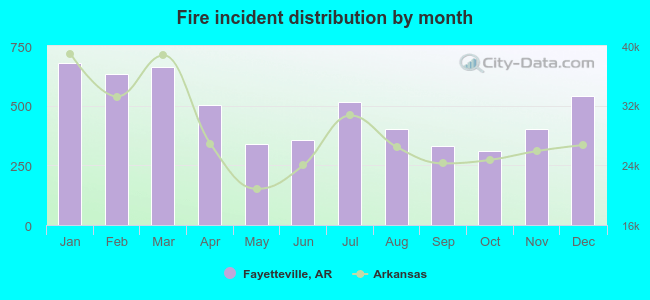 Based on the 5,673 fire incident reports from years 2002 - 2018 most fires (12.0%) took place during January, and the least (5.5%) in October.
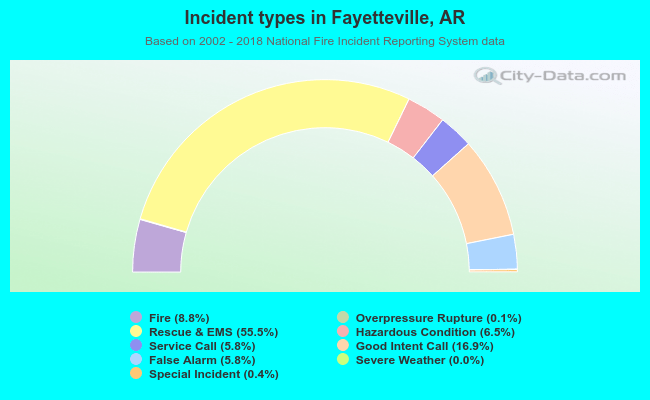 Out of all 64,185 cases reported during the years 2002 - 2018, the most belonged to the categories: Rescue & EMS (55.5%), Good Intent Call (16.9%), and Fire (8.8%).
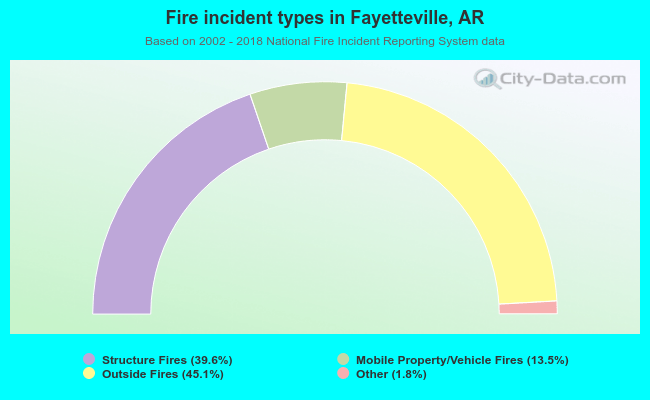 When looking into fire subcategories, the most reports belonged to: Outside Fires (45.1%), and Structure Fires (39.6%).