Centerton: Fire Incidents, Arkansas (AR)
Where are fire incidents reported in Centerton, AR
Something went wrong! Please refresh the page.
|
| |||||||||||||||||||||||||||||||||||||||||||||||||||||||||||||||||||||||||||||||||||||||||||||||||||||||||||||
2003 - 2018 National Fire Incident Reporting System (NFIRS) incidents
- Incident types reported to NFIRS in Centerton, AR
- 4,13862.3%Rescue & EMS
- 1,28219.3%Good Intent Call
- 5848.8%Fire
- 2603.9%False Alarm
- 2063.1%Hazardous Condition
- 1432.2%Service Call
- 250.4%Severe Weather
- Fire incident types reported to NFIRS in Centerton, AR
- 28649.0%Outside Fires
- 27647.3%Structure Fires
- 172.9%Mobile Property/Vehicle Fires
- 50.9%Other
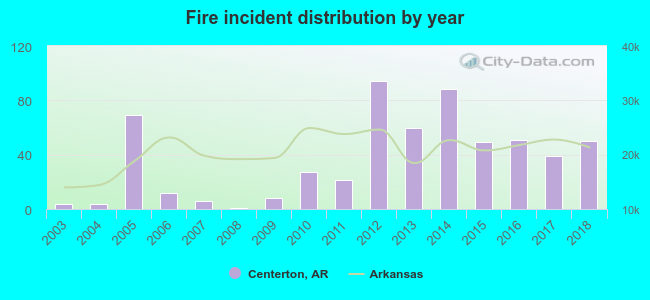 According to the data from the years 2003 - 2018 the average number of fires per year is 36. The highest number of fire incidents - 94 took place in 2012, and the least - 1 in 2008. The data has a growing trend.
The average number of yearly fire incidents per 10k residents in Centerton, AR compared to nearest cities:
(Note: Based on data for the last 3 years, including only cities with population 5,000 and above)
| Centerton: | 41.7 |
| Bentonville: | 36.0 |
| Bella Vista: | 30.7 |
| Rogers: | 34.1 |
| Lowell: | 81.2 |
| Pea Ridge: | 27.4 |
| Springdale: | 34.6 |
| Siloam Springs: | 56.9 |
| Fayetteville: | 40.9 |
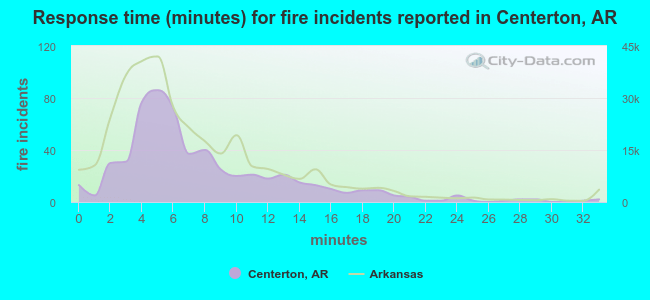 The median response time based on all reported fire incidents is 6 minutes. This is about the same as the Arkansas median value.
The median response time in Centerton, AR compared to nearest cities:
(Note: Based on data for all years, including only cities with at least 500 fire incidents)
| Centerton: | 6 minutes |
| Bentonville: | 5 minutes |
| Bella Vista: | 6 minutes |
| Rogers: | 6 minutes |
| Lowell: | 5 minutes |
| Pea Ridge: | 9 minutes |
| Gentry: | 8 minutes |
| Springdale: | 5 minutes |
| Garfield: | 12 minutes |
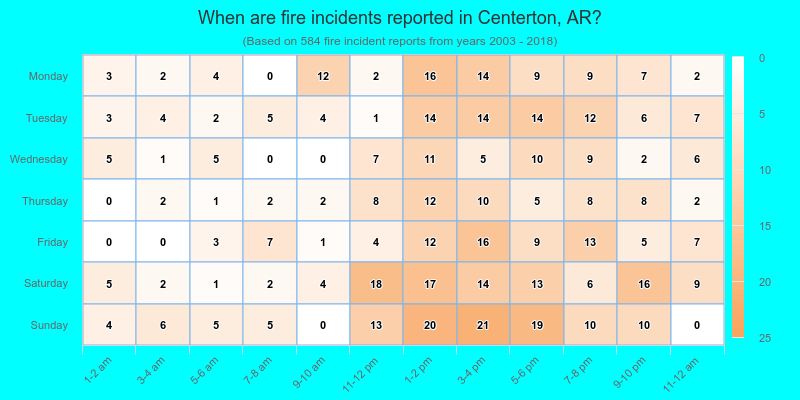
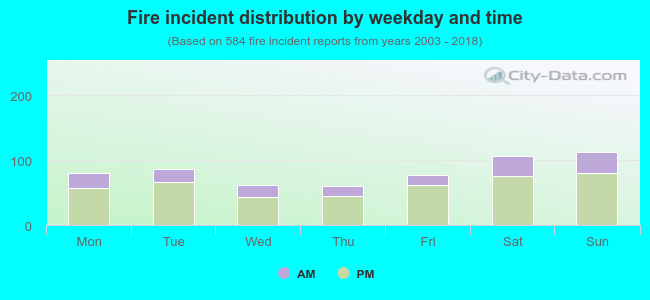 26.5% incidents where reported in the morning and 73.5% in the evening. The most fires (19.3%) took place on Sunday, and the least (10.3%) on Thursday.
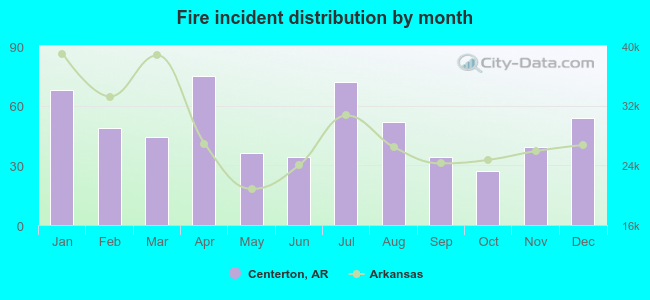 Based on the 584 reports from years 2003 - 2018 most fires (12.8%) took place during April, and the least (4.6%) in October.
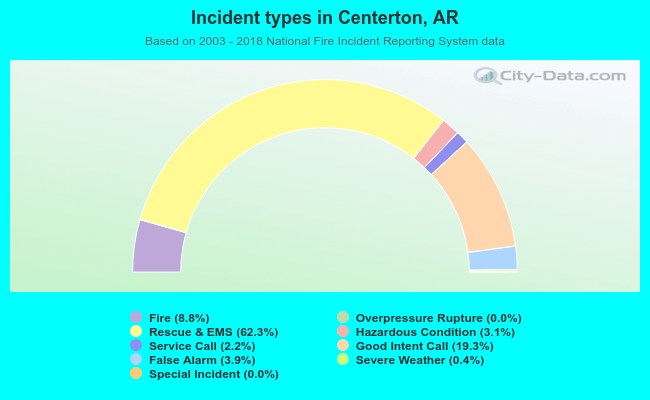 Out of all 6,642 cases reported during the years 2003 - 2018, the most belonged to the categories: Rescue & EMS (62.3%), Good Intent Call (19.3%), and Fire (8.8%).
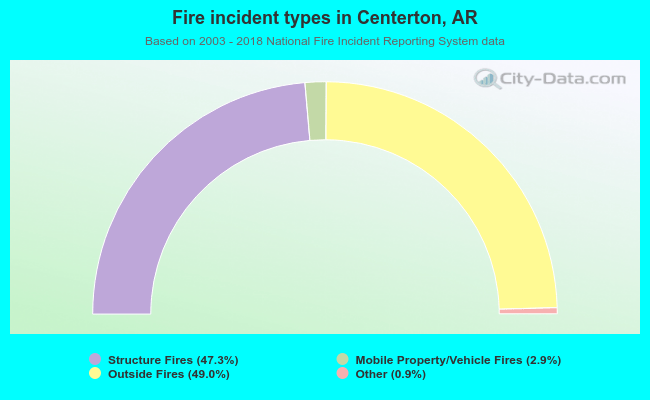 When looking into fire subcategories, the most reports belonged to: Outside Fires (49.0%), and Structure Fires (47.3%).