Fenton: Fire Incidents, Michigan (MI)
Where are fire incidents reported in Fenton, MI
Something went wrong! Please refresh the page.
| Fire incidents reported | |
|---|---|
| Sreet name | Count |
| OWEN RD | 116 |
| LEROY ST | 108 |
| US 23 | 94 |
| TORREY RD | 84 |
| US 23 EXPY | 78 |
| HARTLAND RD | 72 |
| SILVER LAKE RD | 70 |
| NORTH RD | 68 |
| WHITE LAKE RD | 56 |
| US-23 EXPY | 54 |
| FENTON RD | 50 |
| RAY RD | 46 |
| LINDEN RD | 42 |
| MABLEY HILL RD | 42 |
| BENNETT LAKE RD | 40 |
| CLYDE RD | 40 |
| THOMPSON RD | 40 |
| EASTVIEW DR | 36 |
| DENTON HILL RD | 34 |
| HOGAN RD | 32 |
| SHIAWASSEE AVE | 30 |
| CAROLINE ST | 28 |
| LONG LAKE RD | 28 |
| RUNYAN LAKE RD | 28 |
| SILVER PKY | 28 |
| GROVE PARK RD | 26 |
| SOUTH LONG LAKE RD | 26 |
| CENTER RD | 24 |
| FAUSSETT RD | 24 |
| GEORGETOWN PKY | 24 |
| Other | 346 |
2002 - 2018 National Fire Incident Reporting System (NFIRS) incidents
- Incident types reported to NFIRS in Fenton, MI
- 3,86739.4%Rescue & EMS
- 2,04820.9%Hazardous Condition
- 1,81418.5%Fire
- 7547.7%Good Intent Call
- 7357.5%Service Call
- 5585.7%False Alarm
- 150.2%Severe Weather
- 140.1%Overpressure Rupture
- 120.1%Special Incident
- Fire incident types reported to NFIRS in Fenton, MI
- 93251.4%Structure Fires
- 38721.3%Outside Fires
- 35819.7%Mobile Property/Vehicle Fires
- 1377.6%Other
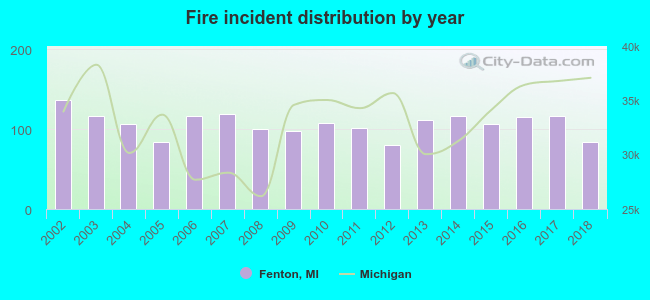 Based on the data from the years 2002 - 2018 the average number of fires per year is 107. The highest number of fire incidents - 136 took place in 2002, and the least - 80 in 2012. The data has a dropping trend.
The average number of yearly fire incidents per 10k residents in Fenton, MI compared to nearest cities:
(Note: Based on data for the last 3 years, including only cities with population 5,000 and above)
| Fenton: | 91.6 |
| Holly: | 105.5 |
| Grand Blanc: | 145.6 |
| Swartz Creek: | 131.2 |
| Burton: | 27.3 |
| Milford: | 53.1 |
| Flint: | 89.8 |
| Howell: | 162.9 |
| Davison: | 116.7 |
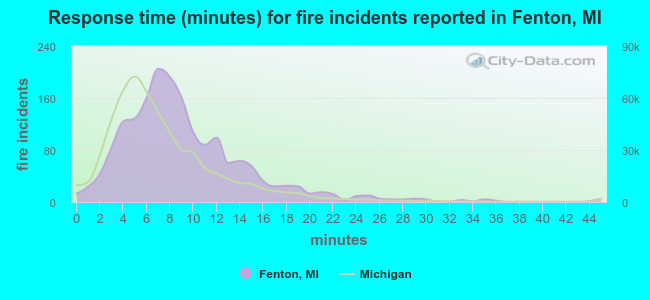 The median response time based on all reported fire incidents is 8 minutes. This is higher than the state median value.
The median response time in Fenton, MI compared to nearest cities:
(Note: Based on data for all years, including only cities with at least 500 fire incidents)
| Fenton: | 8 minutes |
| Linden: | 10 minutes |
| Holly: | 8 minutes |
| Grand Blanc: | 8 minutes |
| Swartz Creek: | 9 minutes |
| Burton: | 8 minutes |
| Ortonville: | 7 minutes |
| Flint: | 7 minutes |
| Durand: | 8 minutes |
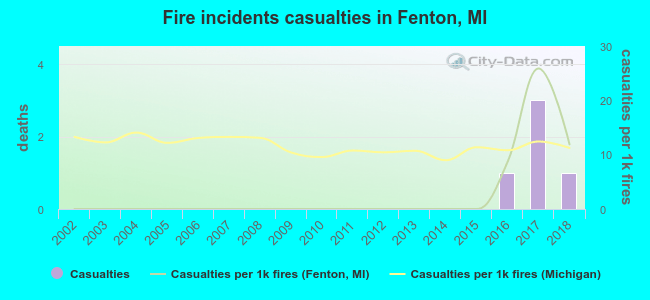 Based on the reports from the years 2002 - 2018 the average number of fire-related yearly casualties is 0. The highest number of reported injuries - 3 took place in 2017, and the lowest - 0 in 2002. The data has a growing trend.
The average number of casualties per 1,000 fire incidents is 3. This indicator was the highest - 26 in 2017, and the lowest 0 in 2002. The trend for injuries per 1,000 fire incidents is rising. Compared to the state value the number of casualties per 1,000 fires is much lower.
Based on the reports from the years 2002 - 2018 the average number of fire-related yearly casualties is 0. The highest number of reported injuries - 3 took place in 2017, and the lowest - 0 in 2002. The data has a growing trend.
The average number of casualties per 1,000 fire incidents is 3. This indicator was the highest - 26 in 2017, and the lowest 0 in 2002. The trend for injuries per 1,000 fire incidents is rising. Compared to the state value the number of casualties per 1,000 fires is much lower.Casualties per 1,000 incidents in Fenton, MI compared to nearest cities:
(Note: Based on data for all years, including only cities with at least 500 fire incidents)
| Fenton: | 2.8 |
| Linden: | 1.2 |
| Holly: | 7.2 |
| Grand Blanc: | 9.4 |
| Swartz Creek: | 4.3 |
| Burton: | 29.0 |
| Ortonville: | 14.2 |
| Flint: | 13.8 |
| Durand: | 8.0 |
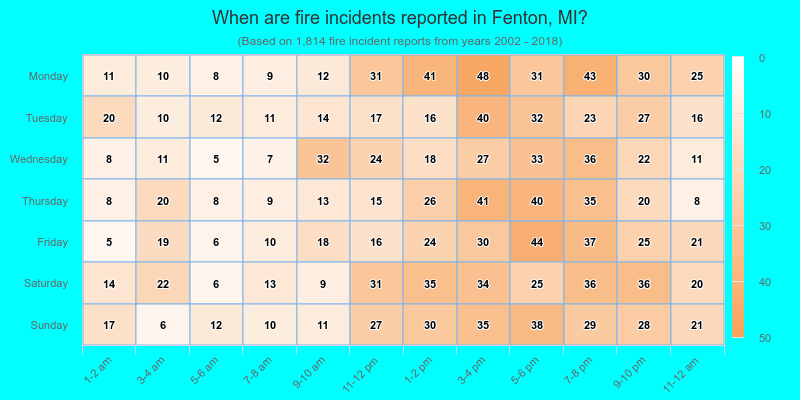
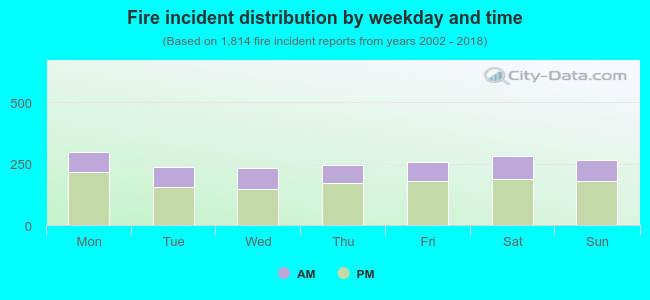 31.8% incidents where reported in the morning and 68.2% in the evening. The most fires (16.5%) took place on Monday, and the least (12.9%) on Wednesday.
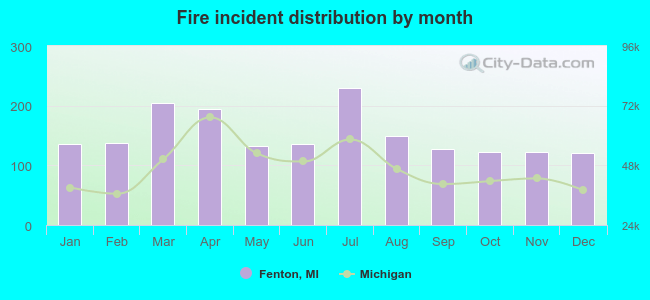 According to the 1,814 fire incident reports from years 2002 - 2018 most fires (12.7%) took place during July, and the least (6.7%) in December.
 Out of all 9,817 cases reported during the years 2002 - 2018, the most belonged to the categories: Rescue & EMS (39.4%), Hazardous Condition (20.9%), and Fire (18.5%).
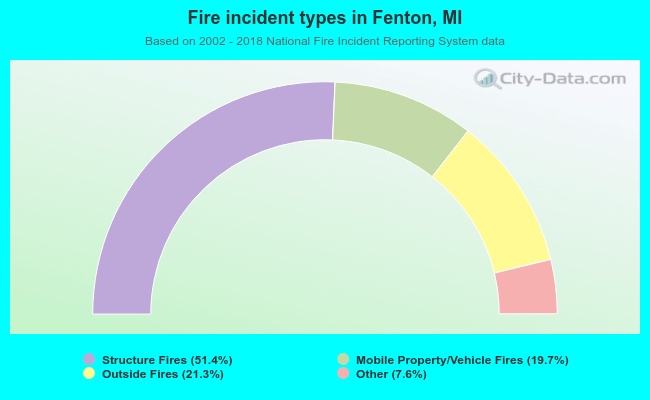 When looking into fire subcategories, the most reports belonged to: Structure Fires (51.4%), and Outside Fires (21.3%).