Flint: Fire Incidents, Michigan (MI)
Where are fire incidents reported in Flint, MI
Something went wrong! Please refresh the page.
| Fire incidents reported | |
|---|---|
| Sreet name | Count |
| DORT HWY | 354 |
| PIERSON RD | 236 |
| SAGINAW ST | 184 |
| CARPENTER RD | 174 |
| COURT ST | 166 |
| GENESEE RD | 156 |
| CENTER RD | 154 |
| COLDWATER RD | 152 |
| FENTON RD | 142 |
| CORUNNA RD | 140 |
| RICHFIELD RD | 122 |
| HILL RD | 120 |
| CLIO RD | 116 |
| BRANCH RD | 104 |
| MACKIN RD | 100 |
| WESTERN RD | 96 |
| DAKOTA AVE | 94 |
| FRANKLIN AVE | 86 |
| MILLER RD | 82 |
| BALLENGER HWY | 76 |
| CONCORD ST | 72 |
| HOME AVE | 72 |
| JULIAH AVE | 72 |
| SUNCREST | 72 |
| CORNELL AVE | 70 |
| FLUSHING RD | 70 |
| VERNON AVE | 70 |
| HAMILTON AVE | 68 |
| LINDEN RD | 66 |
| MARTIN LUTHER KING AVE | 66 |
| Other | 4,765 |
2002 - 2018 National Fire Incident Reporting System (NFIRS) incidents
- Incident types reported to NFIRS in Flint, MI
- 8,53325.6%Good Intent Call
- 8,31725.0%Fire
- 5,00415.0%Hazardous Condition
- 4,38213.2%Rescue & EMS
- 3,59210.8%Service Call
- 3,2889.9%False Alarm
- 730.2%Overpressure Rupture
- 450.1%Special Incident
- 380.1%Severe Weather
- Fire incident types reported to NFIRS in Flint, MI
- 5,15662.0%Structure Fires
- 1,43017.2%Outside Fires
- 1,37916.6%Mobile Property/Vehicle Fires
- 3524.2%Other
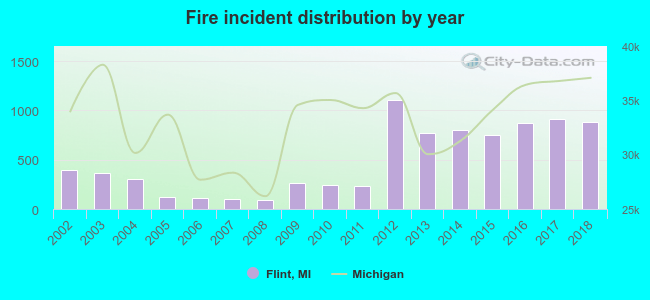 According to the data from the years 2002 - 2018 the average number of fire incidents per year is 489. The highest number of reported fires - 1,103 took place in 2012, and the least - 89 in 2008. The data has a rising trend.
The average number of yearly fire incidents per 10k residents in Flint, MI compared to nearest cities:
(Note: Based on data for the last 3 years, including only cities with population 5,000 and above)
| Flint: | 89.8 |
| Burton: | 27.3 |
| Grand Blanc: | 145.6 |
| Flushing: | 100.8 |
| Swartz Creek: | 131.2 |
| Davison: | 116.7 |
| Fenton: | 91.6 |
| Holly: | 105.5 |
| Lapeer: | 123.3 |
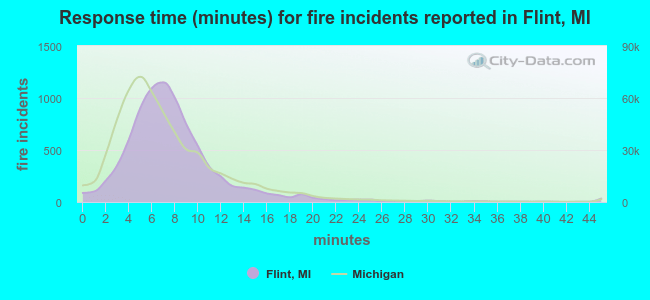 The median response time based on all reported fire incidents is 7 minutes. This is about the same as the Michigan median value.
The median response time in Flint, MI compared to nearest cities:
(Note: Based on data for all years, including only cities with at least 500 fire incidents)
| Flint: | 7 minutes |
| Burton: | 8 minutes |
| Grand Blanc: | 8 minutes |
| Flushing: | 10 minutes |
| Swartz Creek: | 9 minutes |
| Davison: | 8 minutes |
| Clio: | 8 minutes |
| Montrose: | 11 minutes |
| Linden: | 10 minutes |
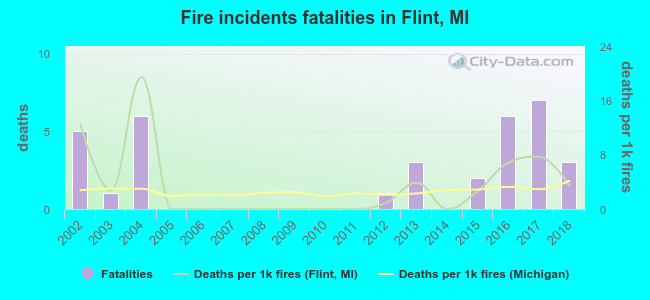 According to the data from the years 2002 - 2018 the average number of fire-related fatalities per year is 2. The highest number of reported deaths - 7 took place in 2017, and the lowest - 0 in 2005. The data has a dropping trend.
The average number of fatalities per 1,000 fire incidents is 4. This indicator was the highest - 19 in 2004, and the lowest 0 in 2005. The trend for deaths per 1,000 fires is dropping. Compared to the Michigan value the number of deaths per 1,000 fires is higher.
According to the data from the years 2002 - 2018 the average number of fire-related fatalities per year is 2. The highest number of reported deaths - 7 took place in 2017, and the lowest - 0 in 2005. The data has a dropping trend.
The average number of fatalities per 1,000 fire incidents is 4. This indicator was the highest - 19 in 2004, and the lowest 0 in 2005. The trend for deaths per 1,000 fires is dropping. Compared to the Michigan value the number of deaths per 1,000 fires is higher.
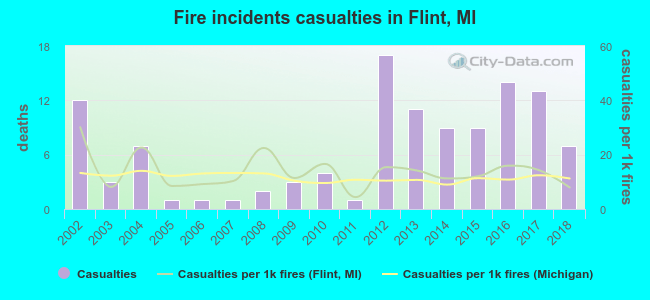 Based on the reports from the years 2002 - 2018 the average number of fire-related casualties per year is 7. The highest number of reported injuries - 17 took place in 2012, and the lowest - 1 in 2005. The data has a decreasing trend.
The average number of casualties per 1,000 fires is 14. This indicator was the highest - 30 in 2002, and the lowest 4 in 2011. The trend for injuries per 1,000 fire incidents is declining. Compared to the Michigan value the number of injuries per 1,000 incidents is about the same.
Based on the reports from the years 2002 - 2018 the average number of fire-related casualties per year is 7. The highest number of reported injuries - 17 took place in 2012, and the lowest - 1 in 2005. The data has a decreasing trend.
The average number of casualties per 1,000 fires is 14. This indicator was the highest - 30 in 2002, and the lowest 4 in 2011. The trend for injuries per 1,000 fire incidents is declining. Compared to the Michigan value the number of injuries per 1,000 incidents is about the same.Casualties per 1,000 incidents in Flint, MI compared to nearest cities:
(Note: Based on data for all years, including only cities with at least 500 fire incidents)
| Flint: | 13.8 |
| Burton: | 29.0 |
| Grand Blanc: | 9.4 |
| Flushing: | 9.8 |
| Swartz Creek: | 4.3 |
| Davison: | 19.4 |
| Clio: | 9.7 |
| Montrose: | 1.6 |
| Linden: | 1.2 |
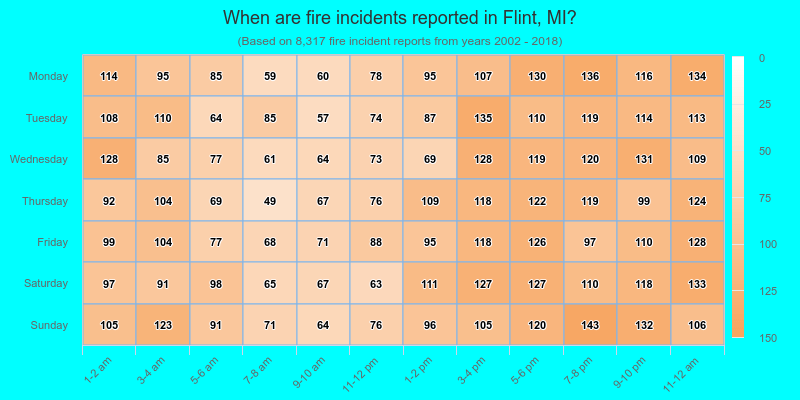
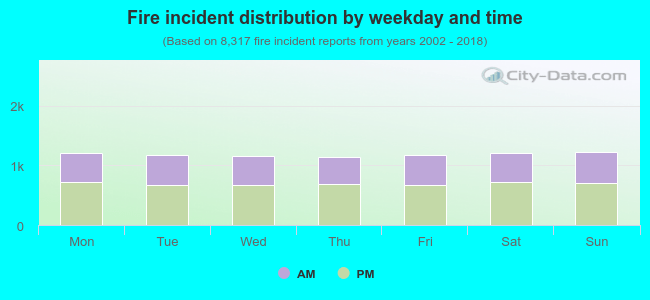 41.5% incidents where reported in the morning and 58.5% in the evening. The most fires (14.8%) took place on Sunday, and the least (13.8%) on Thursday.
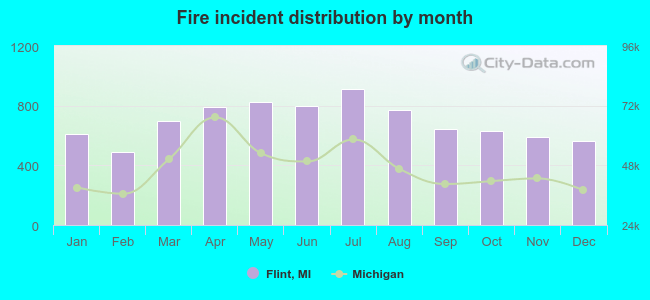 Based on the 8,317 fire incident reports from years 2002 - 2018 most fires (11.0%) took place during July, and the least (5.9%) in February.
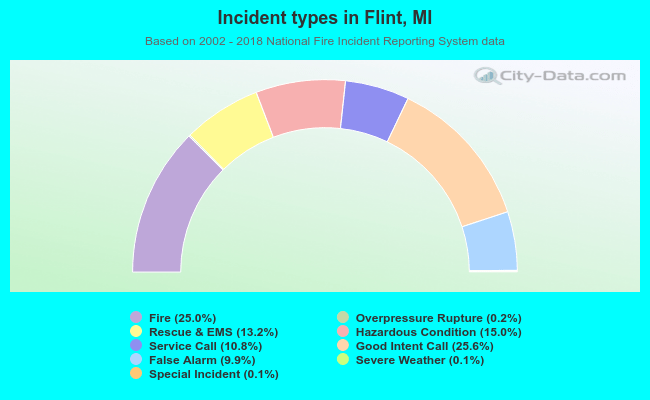 Out of all 33,272 cases reported during the years 2002 - 2018, the most belonged to the categories: Good Intent Call (25.6%), Fire (25.0%), and Hazardous Condition (15.0%).
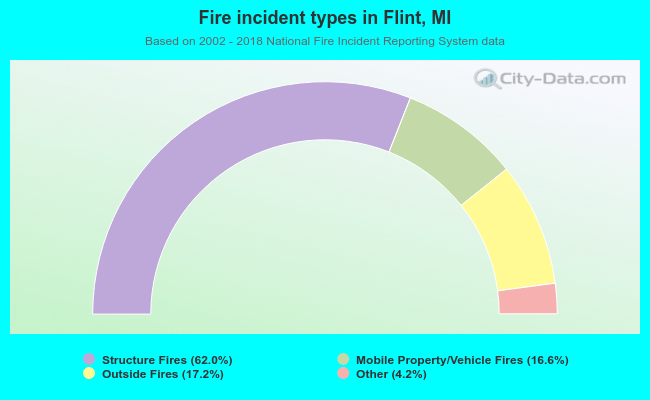 When looking into fire subcategories, the most reports belonged to: Structure Fires (62.0%), and Outside Fires (17.2%).