Finley: Fire Incidents, Washington (WA)
Where are fire incidents reported in Finley, WA
Something went wrong! Please refresh the page.
|
| |||||||||||||||||||||||||||||||||||||||||||||||||||||||||||||||||||||||||||||||||||||||||||||||||||||||||||||
2002 - 2018 National Fire Incident Reporting System (NFIRS) incidents
- Incident types reported to NFIRS in Finley, WA
- 10761.1%Fire
- 4123.4%Rescue & EMS
- 126.9%Good Intent Call
- 116.3%Service Call
- 42.3%Hazardous Condition
- Fire incident types reported to NFIRS in Finley, WA
- 8074.8%Outside Fires
- 1615.0%Structure Fires
- 109.3%Other
- 10.9%Mobile Property/Vehicle Fires
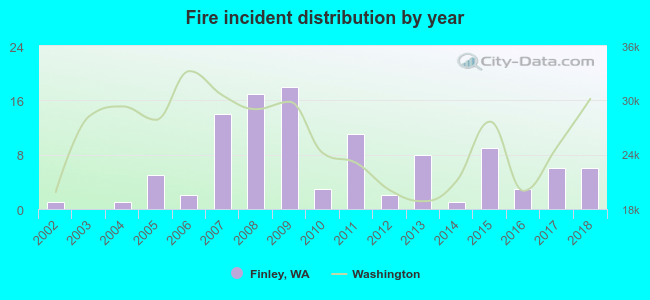 Based on the data from the years 2002 - 2018 the average number of fires per year is 6. The highest number of reported fires - 18 took place in 2009, and the least - 0 in 2003. The data has an increasing trend.
The average number of yearly fire incidents per 10k residents in Finley, WA compared to nearest cities:
(Note: Based on data for the last 3 years, including only cities with population 5,000 and above)
| Finley: | 8.3 |
| Pasco: | 47.5 |
| Kennewick: | 54.0 |
| Richland: | 34.6 |
| West Richland: | 39.9 |
| College Place: | 13.0 |
| Prosser: | 144.2 |
| Connell: | 17.9 |
| Walla Walla: | 26.3 |
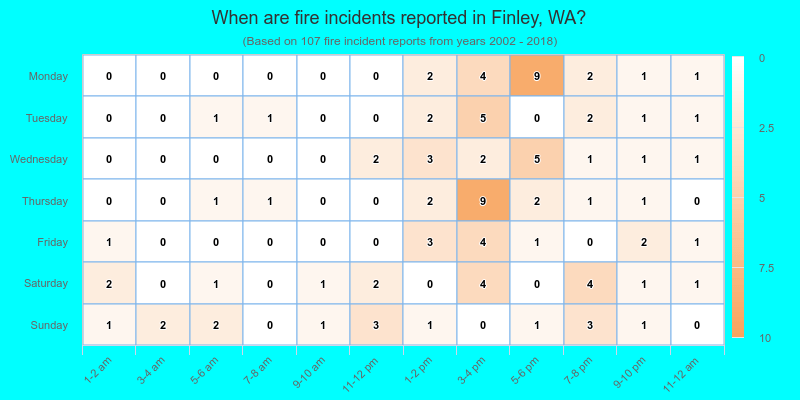
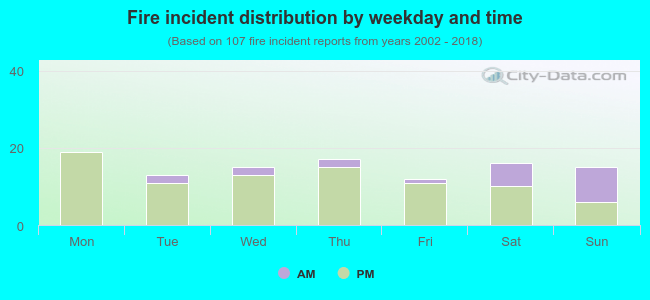 20.6% incidents where reported in the morning and 79.4% in the evening. The most fires (17.8%) took place on Monday, and the least (11.2%) on Friday.
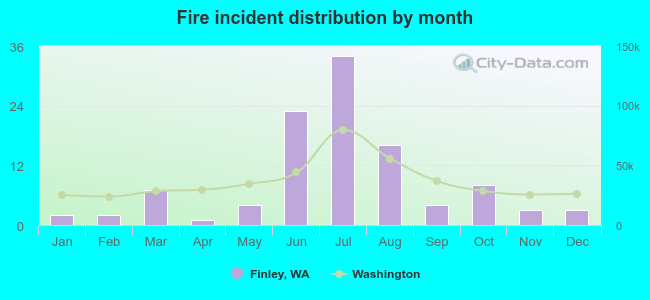 Based on the 107 fire incident reports from years 2002 - 2018 most fires (31.8%) took place during July, and the least (0.9%) in April.
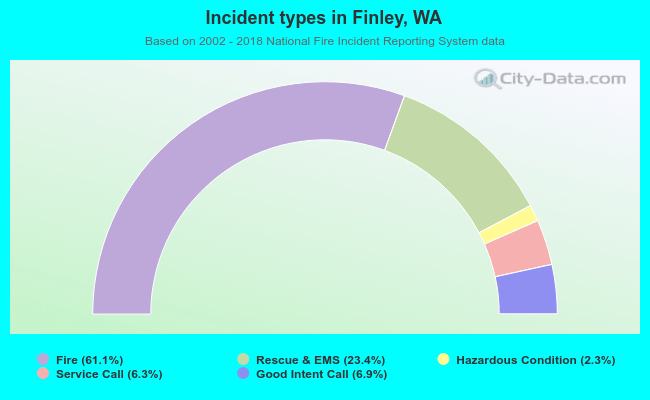 Out of all 175 cases reported during the years 2002 - 2018, the most belonged to the categories: Fire (61.1%), Overpressure Rupture (23.4%), and Service Call (6.9%).
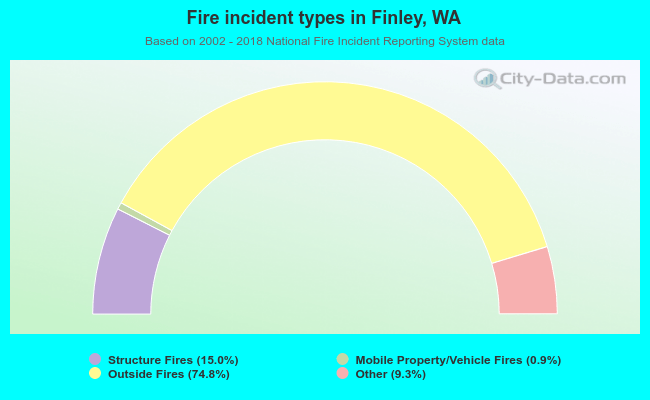 When looking into fire subcategories, the most incidents belonged to: Outside Fires (74.8%), and Structure Fires (15.0%).