Pasco: Fire Incidents, Washington (WA)
Where are fire incidents reported in Pasco, WA
Something went wrong! Please refresh the page.
| Fire incidents reported | |
|---|---|
| Sreet name | Count |
| 4TH AVE | 162 |
| LEWIS ST | 160 |
| COURT ST | 156 |
| SYLVESTER ST | 112 |
| 20TH AVE | 110 |
| SHOSHONE ST | 100 |
| ROAD 68 | 92 |
| JAY ST | 90 |
| 10TH AVE | 88 |
| ROAD 40 | 88 |
| 24TH AVE | 86 |
| OREGON AVE | 86 |
| A ST | 72 |
| CHAPEL HILL BLVD | 66 |
| CLARK ST | 64 |
| BONNEVILLE ST | 60 |
| ELM AVE | 58 |
| 22ND AVE | 56 |
| COLUMBIA RIVER RD | 56 |
| PARK ST | 56 |
| 5TH AVE | 54 |
| 7TH AVE | 54 |
| 14TH AVE | 52 |
| AGATE ST | 52 |
| COLUMBIA ST | 52 |
| NIXON ST | 52 |
| OWEN AVE | 52 |
| RAILROAD AVE | 52 |
| HENRY ST | 50 |
| 18TH AVE | 44 |
| Other | 2,315 |
2002 - 2018 National Fire Incident Reporting System (NFIRS) incidents
- Incident types reported to NFIRS in Pasco, WA
- 12,00757.1%Rescue & EMS
- 4,64722.1%Fire
- 1,4426.9%Good Intent Call
- 1,2355.9%False Alarm
- 8814.2%Service Call
- 7343.5%Hazardous Condition
- 650.3%Special Incident
- 220.1%Overpressure Rupture
- Fire incident types reported to NFIRS in Pasco, WA
- 1,79938.7%Outside Fires
- 1,73137.2%Structure Fires
- 81617.6%Mobile Property/Vehicle Fires
- 3016.5%Other
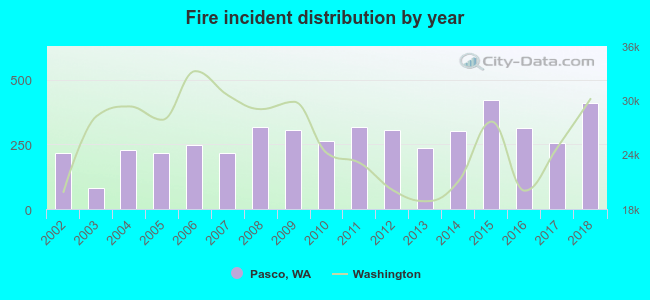 Based on the data from the years 2002 - 2018 the average number of fire incidents per year is 273. The highest number of reported fires - 420 took place in 2015, and the least - 81 in 2003. The data has a growing trend.
The average number of yearly fire incidents per 10k residents in Pasco, WA compared to nearest cities:
(Note: Based on data for the last 3 years, including only cities with population 5,000 and above)
| Pasco: | 47.5 |
| Kennewick: | 54.0 |
| Finley: | 8.3 |
| Richland: | 34.6 |
| West Richland: | 39.9 |
| Connell: | 17.9 |
| Prosser: | 144.2 |
| College Place: | 13.0 |
| Grandview: | 44.6 |
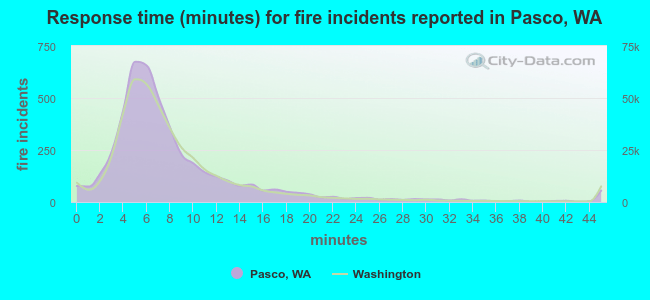 The median response time based on all reported fire incidents is 7 minutes. This is comparable to the Washington median value.
The median response time in Pasco, WA compared to nearest cities:
(Note: Based on data for all years, including only cities with at least 500 fire incidents)
| Pasco: | 7 minutes |
| Kennewick: | 7 minutes |
| Burbank: | 9 minutes |
| Richland: | 6 minutes |
| West Richland: | 8 minutes |
| Benton City: | 9 minutes |
| Hermiston: | 7 minutes |
| Prosser: | 8 minutes |
| Echo: | 9 minutes |
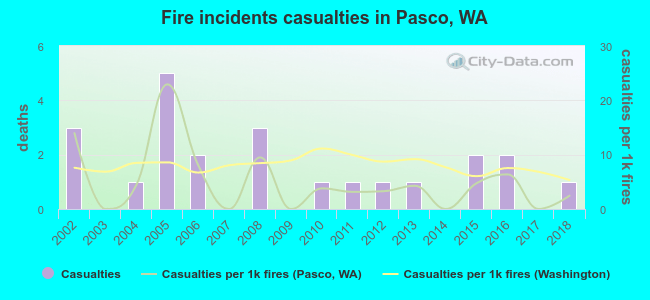 Based on the reports from the years 2002 - 2018 the average number of fire-related yearly casualties is 1. The highest number of reported casualties - 5 took place in 2005, and the lowest - 0 in 2003. The data has a declining trend.
The average number of injuries per 1,000 fires is 5. This indicator was the highest - 23 in 2005, and the lowest 0 in 2003. The trend for injuries per 1,000 incidents is decreasing. Compared to the state value the number of injuries per 1,000 fire incidents is lower.
Based on the reports from the years 2002 - 2018 the average number of fire-related yearly casualties is 1. The highest number of reported casualties - 5 took place in 2005, and the lowest - 0 in 2003. The data has a declining trend.
The average number of injuries per 1,000 fires is 5. This indicator was the highest - 23 in 2005, and the lowest 0 in 2003. The trend for injuries per 1,000 incidents is decreasing. Compared to the state value the number of injuries per 1,000 fire incidents is lower.Casualties per 1,000 incidents in Pasco, WA compared to nearest cities:
(Note: Based on data for all years, including only cities with at least 500 fire incidents)
| Pasco: | 4.9 |
| Kennewick: | 3.5 |
| Burbank: | 3.3 |
| Richland: | 5.7 |
| West Richland: | 7.3 |
| Benton City: | 5.9 |
| Hermiston: | 11.4 |
| Prosser: | 0.0 |
| Echo: | 0.0 |
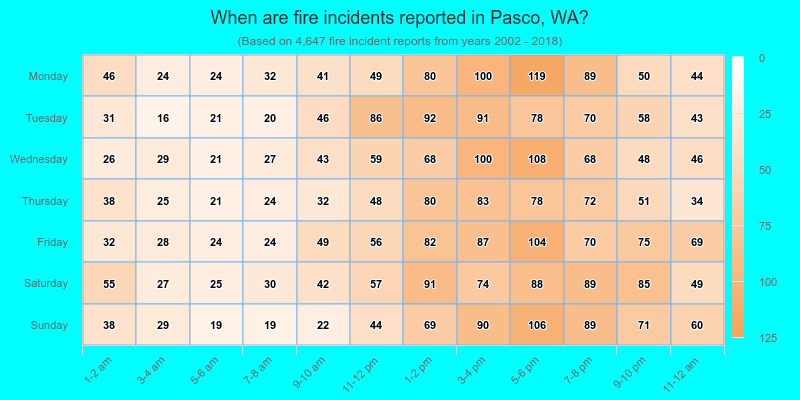
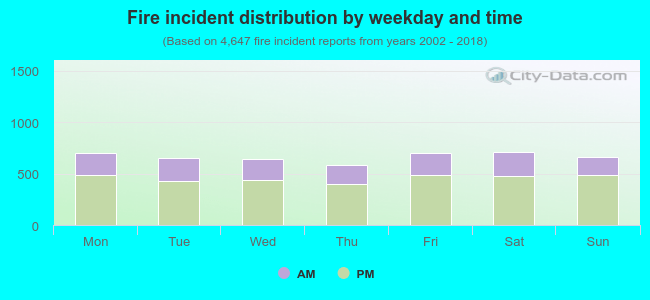 31.2% incidents where reported in the morning and 68.8% in the evening. The most fires (15.3%) took place on Saturday, and the least (12.6%) on Thursday.
 Based on the 4,647 fires from years 2002 - 2018 most fires (16.6%) took place during July, and the least (5.3%) in December.
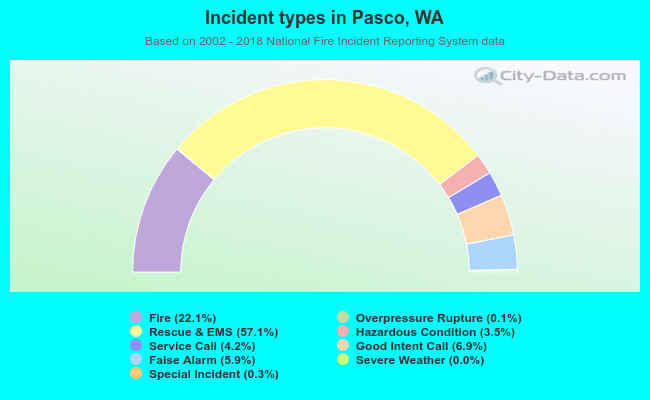 Out of all 21,034 cases reported during the years 2002 - 2018, the most belonged to the categories: Rescue & EMS (57.1%), Fire (22.1%), and Good Intent Call (6.9%).
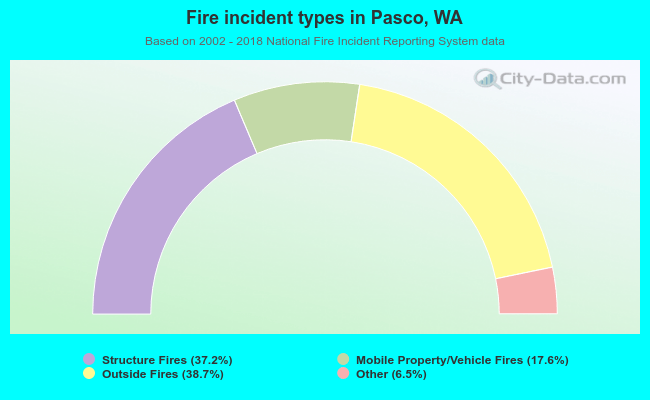 When looking into fire subcategories, the most reports belonged to: Outside Fires (38.7%), and Structure Fires (37.2%).