Lafayette: Fire Incidents, Colorado (CO)
Where are fire incidents reported in Lafayette, CO
Something went wrong! Please refresh the page.
| Fire incidents reported | |
|---|---|
| Sreet name | Count |
| SOUTH BOULDER RD | 162 |
| BASELINE RD | 114 |
| PUBLIC RD | 66 |
| 107TH ST | 62 |
| HIGHWAY 287 | 58 |
| 120TH ST | 42 |
| MERLIN DR | 38 |
| CLEVELAND ST | 36 |
| EXEMPLA CIR | 36 |
| 95TH ST | 30 |
| ARAPAHOE | 30 |
| 111TH ST | 28 |
| EMMA ST | 28 |
| SIMPSON ST | 28 |
| FLAGG DR | 24 |
| MEADOWLARK DR | 24 |
| SIR GALAHAD DR | 24 |
| 112TH ST | 20 |
| CANNON ST | 20 |
| COUNTY LINE RD | 20 |
| GENESEO ST | 20 |
| ELYSIAN FIELD DR | 18 |
| 119TH ST | 16 |
| AVALON AVE | 16 |
| CARIA DR | 16 |
| CENTAUR CIR | 16 |
| CENTAUR VILLAGE DR | 16 |
| HIGHWAY 7 | 16 |
| CARR AVE | 14 |
| CLEVELAND CIR | 14 |
2002 - 2018 National Fire Incident Reporting System (NFIRS) incidents
- Incident types reported to NFIRS in Lafayette, CO
- 9,53561.0%Rescue & EMS
- 1,88512.1%Good Intent Call
- 1,3088.4%Hazardous Condition
- 9846.3%False Alarm
- 9786.3%Fire
- 9235.9%Service Call
- Fire incident types reported to NFIRS in Lafayette, CO
- 43244.2%Structure Fires
- 37738.5%Outside Fires
- 13113.4%Mobile Property/Vehicle Fires
- 383.9%Other
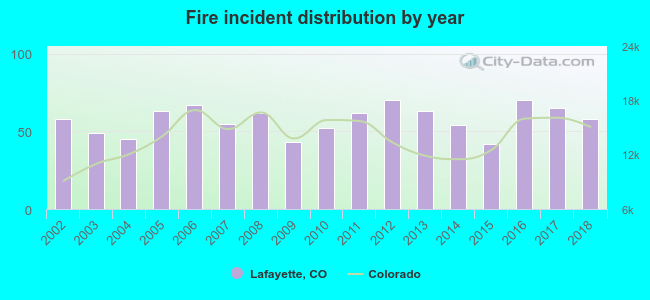 According to the data from the years 2002 - 2018 the average number of fires per year is 58. The highest number of reported fires - 70 took place in 2012, and the least - 42 in 2015. The data has a constant trend.
The average number of yearly fire incidents per 10k residents in Lafayette, CO compared to nearest cities:
(Note: Based on data for the last 3 years, including only cities with population 5,000 and above)
| Lafayette: | 23.8 |
| Louisville: | 17.1 |
| Erie: | 26.0 |
| Broomfield: | 16.5 |
| Superior: | 9.3 |
| Gunbarrel: | 7.6 |
| Boulder: | 32.8 |
| Westminster: | 19.6 |
| Northglenn: | 25.4 |
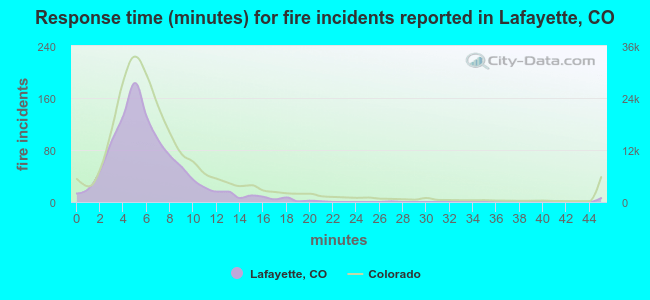 The median response time based on all reported fire incidents is 5 minutes. This is lower compared to the state median value.
The median response time in Lafayette, CO compared to nearest cities:
(Note: Based on data for all years, including only cities with at least 500 fire incidents)
| Lafayette: | 5 minutes |
| Erie: | 7 minutes |
| Broomfield: | 6 minutes |
| Boulder: | 6 minutes |
| Westminster: | 5 minutes |
| Northglenn: | 6 minutes |
| Thornton: | 7 minutes |
| Federal Heights: | 5 minutes |
| Arvada: | 5 minutes |
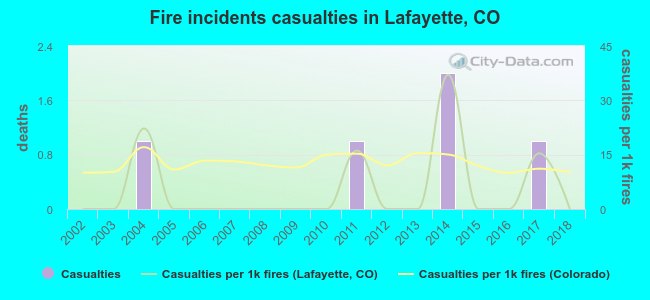 Based on the reports from the years 2002 - 2018 the average number of fire-related yearly casualties is 0. The highest number of injuries - 2 took place in 2014, and the lowest - 0 in 2002. The data has a constant trend.
The average number of casualties per 1,000 fire incidents is 5. This indicator was the highest - 37 in 2014, and the lowest 0 in 2002. The trend for injuries per 1,000 fire incidents is constant. Compared to the state value the number of injuries per 1,000 fire incidents is much lower.
Based on the reports from the years 2002 - 2018 the average number of fire-related yearly casualties is 0. The highest number of injuries - 2 took place in 2014, and the lowest - 0 in 2002. The data has a constant trend.
The average number of casualties per 1,000 fire incidents is 5. This indicator was the highest - 37 in 2014, and the lowest 0 in 2002. The trend for injuries per 1,000 fire incidents is constant. Compared to the state value the number of injuries per 1,000 fire incidents is much lower.Casualties per 1,000 incidents in Lafayette, CO compared to nearest cities:
(Note: Based on data for all years, including only cities with at least 500 fire incidents)
| Lafayette: | 5.1 |
| Erie: | 4.6 |
| Broomfield: | 11.7 |
| Boulder: | 10.5 |
| Westminster: | 34.0 |
| Northglenn: | 9.4 |
| Thornton: | 13.9 |
| Federal Heights: | 21.2 |
| Arvada: | 13.9 |
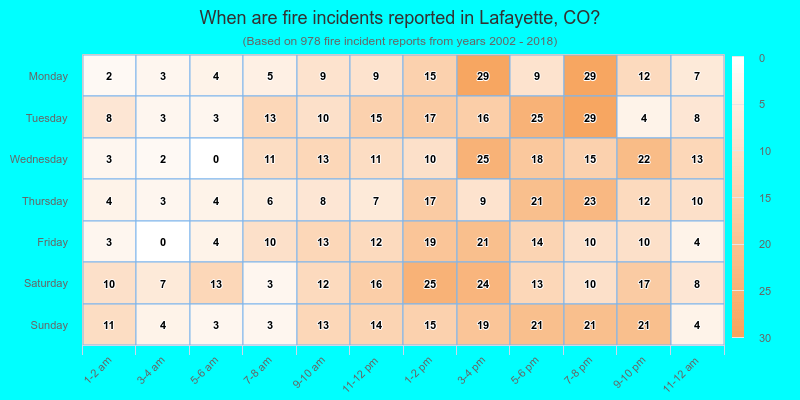
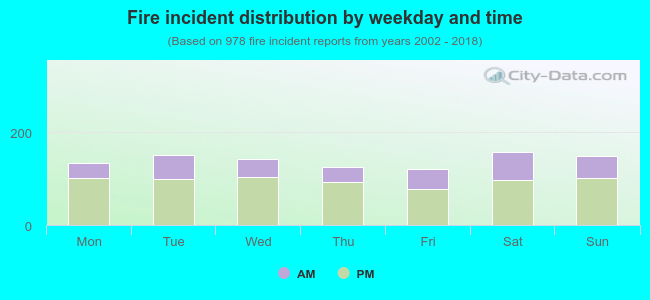 31.4% incidents where reported in the morning and 68.6% in the evening. The most fires (16.2%) took place on Saturday, and the least (12.3%) on Friday.
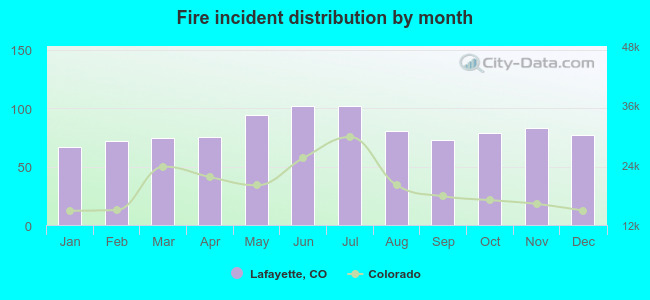 Based on the 978 reports from years 2002 - 2018 most fires (10.4%) took place during June, and the least (6.9%) in January.
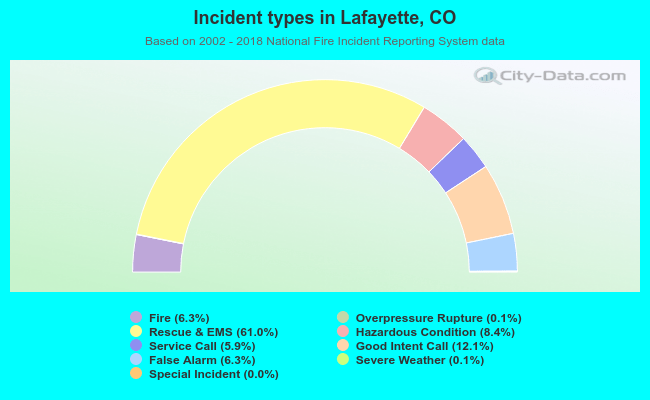 Out of all 15,642 cases reported during the years 2002 - 2018, the most belonged to the categories: Rescue & EMS (61.0%), Good Intent Call (12.1%), and Hazardous Condition (8.4%).
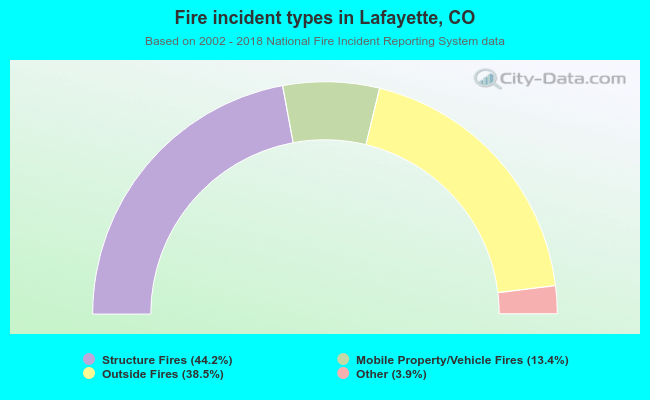 When looking into fire subcategories, the most reports belonged to: Structure Fires (44.2%), and Outside Fires (38.5%).