Forrest City: Fire Incidents, Arkansas (AR)
Where are fire incidents reported in Forrest City, AR
Something went wrong! Please refresh the page.
| Fire incidents reported | |
|---|---|
| Sreet name | Count |
| WASHINGTON AVE | 104 |
| BROADWAY AVE | 90 |
| DIVISION AVE | 74 |
| HWY 284 | 48 |
| I-40 INT | 48 |
| I40 | 48 |
| IZARD AVE | 38 |
| ROSSER | 38 |
| I 40 | 36 |
| LAUGHRUN DR | 34 |
| I-40 | 32 |
| HOLIDAY DR | 30 |
| RICE | 30 |
| FRONT AVE | 28 |
| GROBMYER CIR | 28 |
| MANN | 28 |
| HWY 70 | 24 |
| I40 INT | 24 |
| SHARPE | 24 |
| SFC 214 | 22 |
| SFC 311 | 22 |
| CRAWFORD AVE | 20 |
| DAVIS AVE | 20 |
| DOOLEY AVE | 20 |
| LANEY DR | 20 |
| ROBINSON | 20 |
| SFC 224 RD | 20 |
| BUFORD AVE | 18 |
| DAWSON RD | 18 |
| NEWCASTLE RD | 18 |
| Other | 855 |
2002 - 2018 National Fire Incident Reporting System (NFIRS) incidents
- Incident types reported to NFIRS in Forrest City, AR
- 1,93038.2%Rescue & EMS
- 1,87937.2%Fire
- 4468.8%Hazardous Condition
- 4198.3%False Alarm
- 2354.7%Good Intent Call
- 1022.0%Service Call
- 170.3%Overpressure Rupture
- 150.3%Special Incident
- 90.2%Severe Weather
- Fire incident types reported to NFIRS in Forrest City, AR
- 73239.0%Outside Fires
- 72738.7%Structure Fires
- 38320.4%Mobile Property/Vehicle Fires
- 372.0%Other
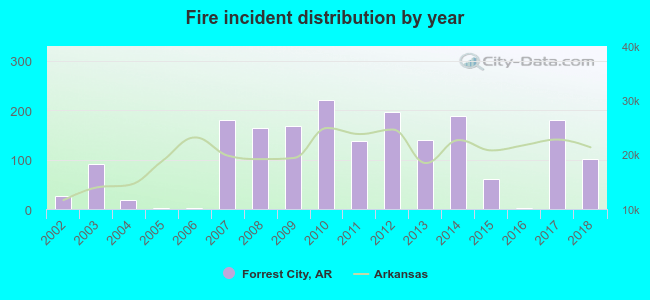 Based on the data from the years 2002 - 2018 the average number of fires per year is 111. The highest number of fire incidents - 220 took place in 2010, and the least - 2 in 2005. The data has an increasing trend.
The average number of yearly fire incidents per 10k residents in Forrest City, AR compared to nearest cities:
(Note: Based on data for the last 3 years, including only cities with population 5,000 and above)
| Forrest City: | 64.1 |
| Wynne: | 121.5 |
| West Helena: | 11.5 |
| Helena: | 79.6 |
| West Memphis: | 88.5 |
| Marion: | 83.3 |
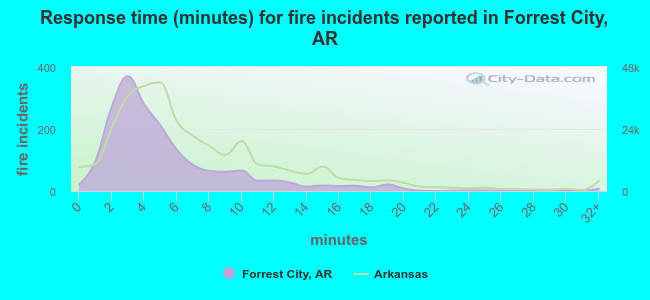 The median response time based on all reported fire incidents is 4 minutes. This is lower compared to the Arkansas median value.
The median response time in Forrest City, AR compared to nearest cities:
(Note: Based on data for all years, including only cities with at least 500 fire incidents)
| Forrest City: | 4 minutes |
| Wynne: | 4 minutes |
| Marianna: | 5 minutes |
| Hughes: | 5 minutes |
| Brinkley: | 6 minutes |
| Earle: | 5 minutes |
| West Helena: | 3 minutes |
| Helena-West Helena: | 3 minutes |
| Helena: | 3 minutes |
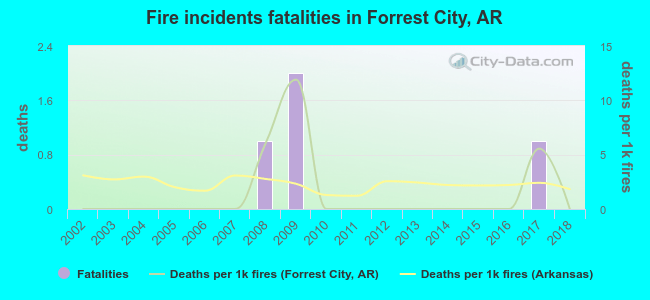 Based on the data from the years 2002 - 2018 the average number of fire-related yearly deaths is 0. The highest number of deaths - 2 took place in 2009, and the lowest - 0 in 2002. The data has a constant trend.
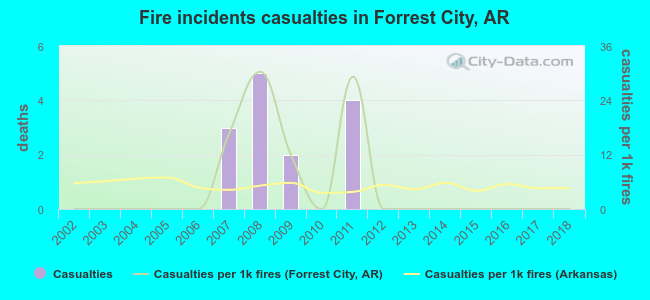 According to the reports from the years 2002 - 2018 the average number of fire-related yearly casualties is 1. The highest number of reported casualties - 5 took place in 2008, and the lowest - 0 in 2002. The data has a constant trend.
The average number of casualties per 1,000 fire incidents is 5. This indicator was the highest - 30 in 2008, and the lowest 0 in 2002. The trend for injuries per 1,000 incidents is constant. Compared to the state value the number of casualties per 1,000 fire incidents is higher.
According to the reports from the years 2002 - 2018 the average number of fire-related yearly casualties is 1. The highest number of reported casualties - 5 took place in 2008, and the lowest - 0 in 2002. The data has a constant trend.
The average number of casualties per 1,000 fire incidents is 5. This indicator was the highest - 30 in 2008, and the lowest 0 in 2002. The trend for injuries per 1,000 incidents is constant. Compared to the state value the number of casualties per 1,000 fire incidents is higher.Casualties per 1,000 incidents in Forrest City, AR compared to nearest cities:
(Note: Based on data for all years, including only cities with at least 500 fire incidents)
| Forrest City: | 7.5 |
| Wynne: | 1.7 |
| Marianna: | 0.0 |
| Hughes: | 0.0 |
| Brinkley: | 0.0 |
| Earle: | 1.3 |
| West Helena: | 7.3 |
| Helena-West Helena: | 12.4 |
| Helena: | 3.4 |
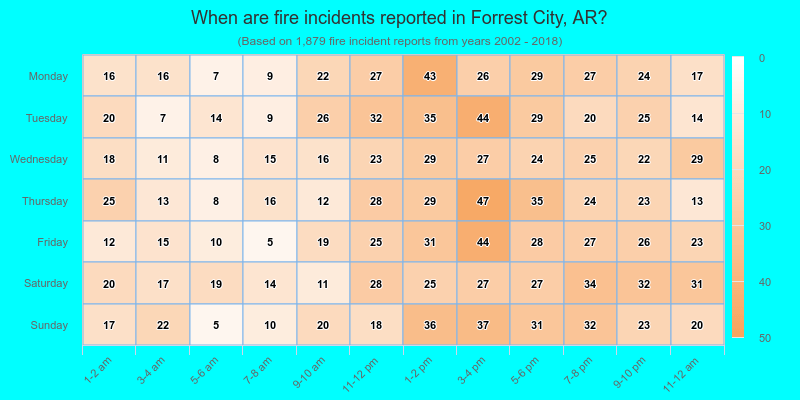
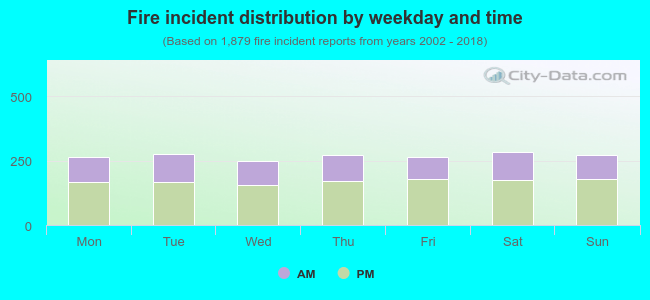 36.5% incidents where reported in the morning and 63.5% in the evening. The most fires (15.2%) took place on Saturday, and the least (13.1%) on Wednesday.
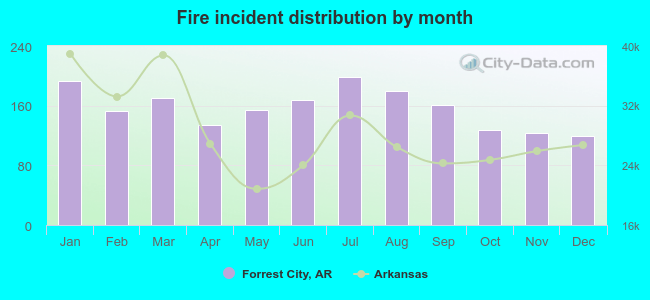 Based on the 1,879 fires from years 2002 - 2018 most fires (10.6%) took place during July, and the least (6.3%) in December.
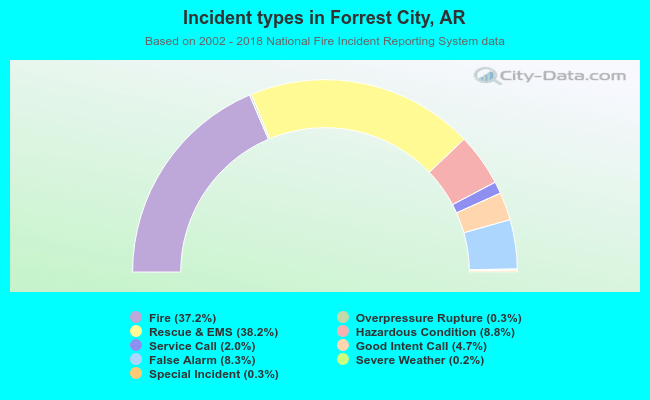 Out of all 5,052 cases reported during the years 2002 - 2018, the most belonged to the categories: Rescue & EMS (38.2%), Fire (37.2%), and Hazardous Condition (8.8%).
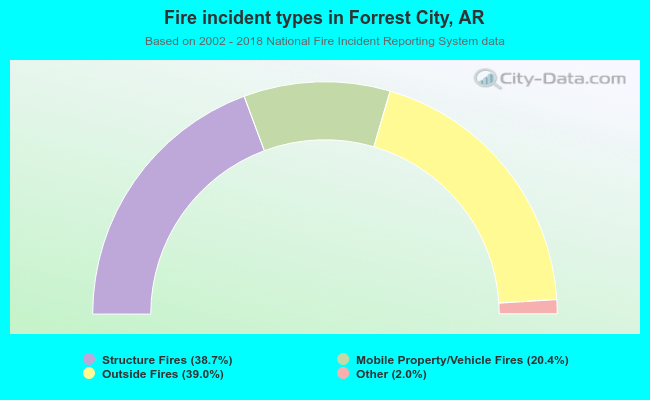 When looking into fire subcategories, the most incidents belonged to: Outside Fires (39.0%), and Structure Fires (38.7%).