Helena: Fire Incidents, Arkansas (AR)
Where are fire incidents reported in Helena, AR
Something went wrong! Please refresh the page.
|
| |||||||||||||||||||||||||||||||||||||||||||||||||||||||||||||||||||||||||||||||||||||||||||||||||||||||||||||
2002 - 2018 National Fire Incident Reporting System (NFIRS) incidents
- Incident types reported to NFIRS in Helena, AR
- 58668.9%Fire
- 738.6%Service Call
- 728.5%Rescue & EMS
- 424.9%False Alarm
- 414.8%Good Intent Call
- 364.2%Hazardous Condition
- 10.1%Special Incident
- Fire incident types reported to NFIRS in Helena, AR
- 28248.1%Structure Fires
- 15025.6%Outside Fires
- 12220.8%Mobile Property/Vehicle Fires
- 325.5%Other
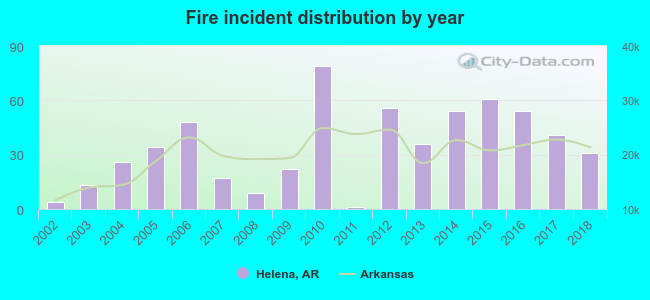 Based on the data from the years 2002 - 2018 the average number of fires per year is 34. The highest number of reported fires - 79 took place in 2010, and the least - 1 in 2011. The data has a rising trend.
The average number of yearly fire incidents per 10k residents in Helena, AR compared to nearest cities:
(Note: Based on data for the last 3 years, including only cities with population 5,000 and above)
| Helena: | 79.6 |
| West Helena: | 11.5 |
| Forrest City: | 64.1 |
| West Memphis: | 88.5 |
| Wynne: | 121.5 |
 The median response time based on all reported fire incidents is 3 minutes. This is much lower compared to the state median value.
The median response time in Helena, AR compared to nearest cities:
(Note: Based on data for all years, including only cities with at least 500 fire incidents)
| Helena: | 3 minutes |
| Helena-West Helena: | 3 minutes |
| West Helena: | 3 minutes |
| Marianna: | 5 minutes |
| Hughes: | 5 minutes |
| Forrest City: | 4 minutes |
| Brinkley: | 6 minutes |
| West Memphis: | 5 minutes |
| Wynne: | 4 minutes |
 42.3% incidents where reported in the morning and 57.7% in the evening. The most fires (16.6%) took place on Saturday, and the least (12.5%) on Thursday.
 According to the 586 fire incidents from years 2002 - 2018 most fires (10.4%) took place during October, and the least (5.5%) in December.
 Out of all 851 cases reported during the years 2002 - 2018, the most belonged to the categories: Fire (68.9%), Hazardous Condition (8.6%), and Overpressure Rupture (8.5%).
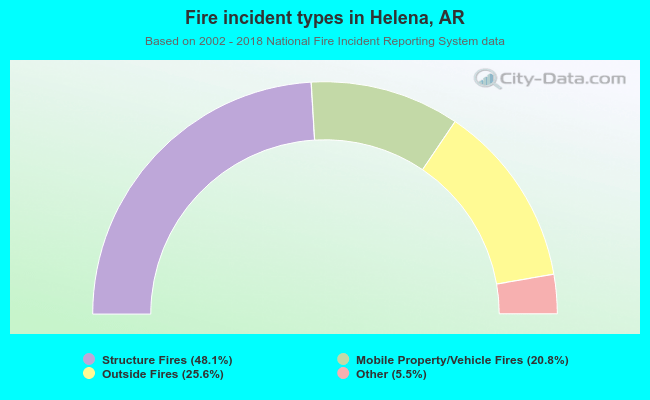 When looking into fire subcategories, the most reports belonged to: Structure Fires (48.1%), and Outside Fires (25.6%).