Forsyth: Fire Incidents, Georgia (GA)
Where are fire incidents reported in Forsyth, GA
Something went wrong! Please refresh the page.
|
| |||||||||||||||||||||||||||||||||||||||||||||||||||||||||||||||||||||||||||||||||||||||||||||||||||||||||||||
| Other | 543 | |||||||||||||||||||||||||||||||||||||||||||||||||||||||||||||||||||||||||||||||||||||||||||||||||||||||||||||
2002 - 2018 National Fire Incident Reporting System (NFIRS) incidents
- Incident types reported to NFIRS in Forsyth, GA
- 10,00672.0%Rescue & EMS
- 1,3679.8%Fire
- 8806.3%Good Intent Call
- 5473.9%False Alarm
- 5123.7%Service Call
- 4623.3%Hazardous Condition
- 530.4%Severe Weather
- 390.3%Special Incident
- 370.3%Overpressure Rupture
- Fire incident types reported to NFIRS in Forsyth, GA
- 50036.6%Outside Fires
- 41030.0%Structure Fires
- 33824.7%Mobile Property/Vehicle Fires
- 1198.7%Other
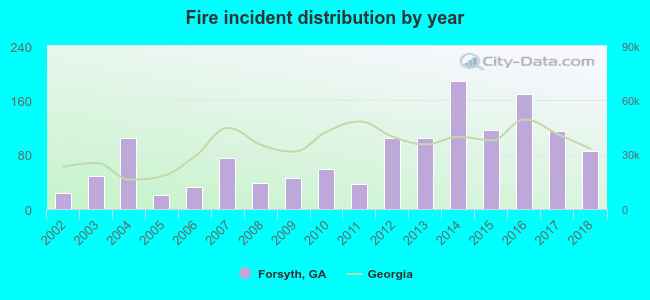 Based on the data from the years 2002 - 2018 the average number of fire incidents per year is 80. The highest number of fires - 188 took place in 2014, and the least - 20 in 2005. The data has a rising trend.
 The median response time based on all reported fire incidents is 6 minutes. This is close to the Georgia median value.
The median response time in Forsyth, GA compared to nearest cities:
(Note: Based on data for all years, including only cities with at least 500 fire incidents)
| Forsyth: | 6 minutes |
| Barnesville: | 6 minutes |
| Jackson: | 6 minutes |
| Macon: | 4 minutes |
| Roberta: | 12 minutes |
| Gray: | 6 minutes |
| Locust Grove: | 8 minutes |
| Griffin: | 5 minutes |
| Thomaston: | 5 minutes |
 Based on the reports from the years 2002 - 2018 the average number of fire-related yearly deaths is 0. The highest number of reported deaths - 1 took place in 2014, and the lowest - 0 in 2002. The data has a growing trend.
 29.6% incidents where reported in the morning and 70.4% in the evening. The most fires (16.2%) took place on Friday, and the least (12.2%) on Wednesday.
 According to the 1,367 incident reports from years 2002 - 2018 most fires (16.4%) took place during March, and the least (3.7%) in December.
 Out of all 13,903 cases reported during the years 2002 - 2018, the most belonged to the categories: Rescue & EMS (72.0%), Fire (9.8%), and Good Intent Call (6.3%).
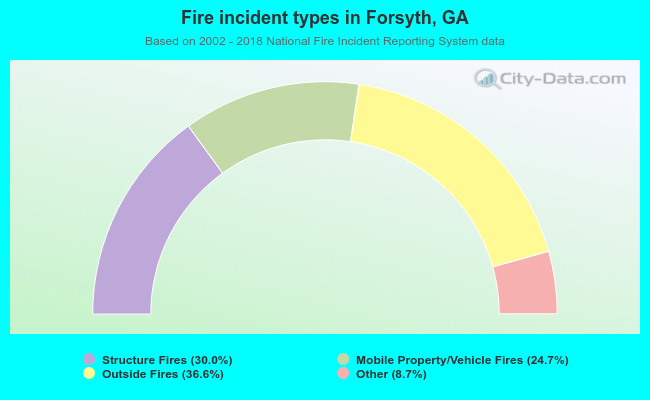 When looking into fire subcategories, the most reports belonged to: Outside Fires (36.6%), and Structure Fires (30.0%).