Macon: Fire Incidents, Georgia (GA)
Where are fire incidents reported in Macon, GA
Something went wrong! Please refresh the page.
| Fire incidents reported | |
|---|---|
| Sreet name | Count |
| VINEVILLE AVE | 404 |
| FORSYTH ST | 332 |
| RIVERSIDE DR | 332 |
| NAPIER AVE | 278 |
| MERCER UNIVERSITY DR | 276 |
| PIO NONO AVE | 248 |
| HOUSTON AVE | 234 |
| HOUSTON RD | 204 |
| GRAY HWY | 202 |
| EISENHOWER PKY | 186 |
| LOG CABIN DR | 180 |
| THOMASTON RD | 162 |
| JEFFERSONVILLE RD | 158 |
| HAWKINSVILLE RD | 152 |
| NORTHSIDE DR | 152 |
| ZEBULON RD | 148 |
| BLOOMFIELD RD | 136 |
| ROCKY CREEK RD | 134 |
| BLOOMFIELD DR | 126 |
| CHERRY ST | 104 |
| WESLEYAN DR | 100 |
| CLINTON RD | 92 |
| SECOND ST | 88 |
| ANTHONY RD | 86 |
| SHURLING DR | 86 |
| FORSYTH RD | 74 |
| PLANT ST | 72 |
| WILLIAMSON RD | 68 |
| HARRISON RD | 66 |
| BROADWAY | 64 |
| Other | 9,826 |
2003 - 2018 National Fire Incident Reporting System (NFIRS) incidents
- Incident types reported to NFIRS in Macon, GA
- 36,99850.1%Rescue & EMS
- 14,77020.0%Fire
- 8,06610.9%False Alarm
- 7,38310.0%Hazardous Condition
- 3,3514.5%Good Intent Call
- 3,1654.3%Service Call
- Fire incident types reported to NFIRS in Macon, GA
- 6,23442.2%Outside Fires
- 5,97940.5%Structure Fires
- 2,41016.3%Mobile Property/Vehicle Fires
- 1471.0%Other
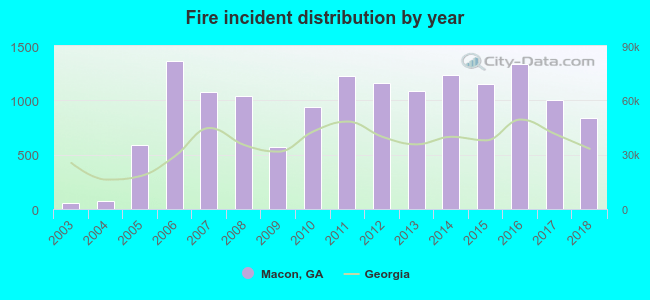 According to the data from the years 2003 - 2018 the average number of fires per year is 922. The highest number of fire incidents - 1,366 took place in 2006, and the least - 55 in 2003. The data has an increasing trend.
The average number of yearly fire incidents per 10k residents in Macon, GA compared to nearest cities:
(Note: Based on data for the last 3 years, including only cities with population 5,000 and above)
| Macon: | 117.8 |
| Lizella: | 21.5 |
| Centerville: | 42.2 |
| Warner Robins: | 45.5 |
| Fort Valley: | 39.1 |
| Perry: | 66.9 |
| Milledgeville: | 136.4 |
| Barnesville: | 151.9 |
| Eatonton: | 187.1 |
 The median response time based on all reported fire incidents is 4 minutes. This is lower than the Georgia median value.
The median response time in Macon, GA compared to nearest cities:
(Note: Based on data for all years, including only cities with at least 500 fire incidents)
| Macon: | 4 minutes |
| Gray: | 6 minutes |
| Byron: | 6 minutes |
| Warner Robins: | 6 minutes |
| Forsyth: | 6 minutes |
| Roberta: | 12 minutes |
| Fort Valley: | 4 minutes |
| Perry: | 7 minutes |
| Milledgeville: | 6 minutes |
 According to the data from the years 2003 - 2018 the average number of fire-related fatalities per year is 2. The highest number of deaths - 7 took place in 2008, and the lowest - 0 in 2003. The data has a constant trend.
The average number of deaths per 1,000 fires is 1. This indicator was the highest - 7 in 2008, and the lowest 0 in 2003. The trend for deaths per 1,000 incidents is growing. Compared to the Georgia value the number of fatalities per 1,000 fire incidents is lower.
According to the data from the years 2003 - 2018 the average number of fire-related fatalities per year is 2. The highest number of deaths - 7 took place in 2008, and the lowest - 0 in 2003. The data has a constant trend.
The average number of deaths per 1,000 fires is 1. This indicator was the highest - 7 in 2008, and the lowest 0 in 2003. The trend for deaths per 1,000 incidents is growing. Compared to the Georgia value the number of fatalities per 1,000 fire incidents is lower.Deaths per 1,000 incidents in Macon, GA compared to nearest cities:
(Note: Based on data for all years, including only cities with at least 2,500 fire incidents)
| Macon: | 1.6 |
| Warner Robins: | 1.4 |
| Milledgeville: | 0.9 |
| Jackson: | 0.8 |
 Based on the data from the years 2003 - 2018 the average number of fire-related casualties per year is 2. The highest number of reported injuries - 9 took place in 2007, and the lowest - 0 in 2003. The data has a growing trend.
The average number of injuries per 1,000 fire incidents is 2. This indicator was the highest - 8 in 2007, and the lowest 0 in 2003. The trend for casualties per 1,000 fires is increasing. Compared to the state value the number of casualties per 1,000 fires is much lower.
Based on the data from the years 2003 - 2018 the average number of fire-related casualties per year is 2. The highest number of reported injuries - 9 took place in 2007, and the lowest - 0 in 2003. The data has a growing trend.
The average number of injuries per 1,000 fire incidents is 2. This indicator was the highest - 8 in 2007, and the lowest 0 in 2003. The trend for casualties per 1,000 fires is increasing. Compared to the state value the number of casualties per 1,000 fires is much lower.Casualties per 1,000 incidents in Macon, GA compared to nearest cities:
(Note: Based on data for all years, including only cities with at least 500 fire incidents)
| Macon: | 2.5 |
| Gray: | 12.1 |
| Byron: | 9.1 |
| Warner Robins: | 18.1 |
| Forsyth: | 0.7 |
| Roberta: | 0.0 |
| Fort Valley: | 12.8 |
| Perry: | 10.4 |
| Milledgeville: | 2.5 |
 30.9% incidents where reported in the morning and 69.1% in the evening. The most fires (15.1%) took place on Saturday, and the least (13.4%) on Tuesday.
 According to the 14,770 fire incident reports from years 2003 - 2018 most fires (9.9%) took place during January, and the least (6.2%) in August.
 Out of all 73,809 cases reported during the years 2003 - 2018, the most belonged to the categories: Rescue & EMS (50.1%), Fire (20.0%), and False Alarm (10.9%).
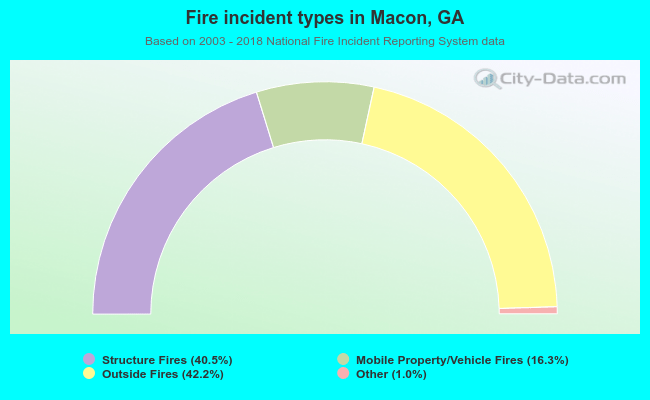 When looking into fire subcategories, the most incidents belonged to: Outside Fires (42.2%), and Structure Fires (40.5%).