Fort Stockton: Fire Incidents, Texas (TX)
Where are fire incidents reported in Fort Stockton, TX
Something went wrong! Please refresh the page.
|
| |||||||||||||||||||||||||||||||||||||||||||||||||||||||||||||||||||||||||||||||||||||||||||||||||||||||||||||
2004 - 2018 National Fire Incident Reporting System (NFIRS) incidents
- Incident types reported to NFIRS in Fort Stockton, TX
- 44082.9%Fire
- 5810.9%Hazardous Condition
- 183.4%Service Call
- 112.1%Good Intent Call
- 30.6%Rescue & EMS
- 10.2%Special Incident
- Fire incident types reported to NFIRS in Fort Stockton, TX
- 26860.9%Outside Fires
- 9020.5%Structure Fires
- 7416.8%Mobile Property/Vehicle Fires
- 81.8%Other
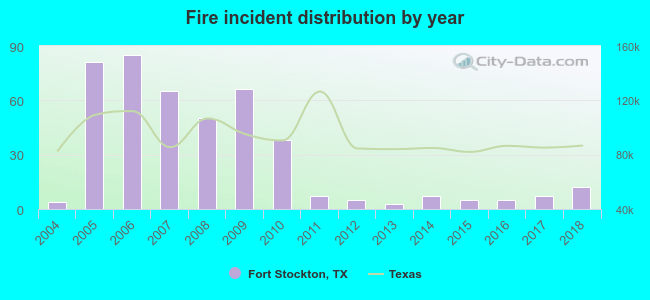 According to the data from the years 2004 - 2018 the average number of fire incidents per year is 29. The highest number of reported fire incidents - 85 took place in 2006, and the least - 3 in 2013. The data has an increasing trend.
The average number of yearly fire incidents per 10k residents in Fort Stockton, TX compared to nearest cities:
(Note: Based on data for the last 3 years, including only cities with population 5,000 and above)
| Fort Stockton: | 9.4 |
| Monahans: | 22.3 |
| Alpine: | 1.7 |
| West Odessa: | 36.0 |
| Odessa: | 55.7 |
| Midland: | 23.6 |
| Andrews: | 141.4 |
| Big Spring: | 67.3 |
| San Angelo: | 20.7 |
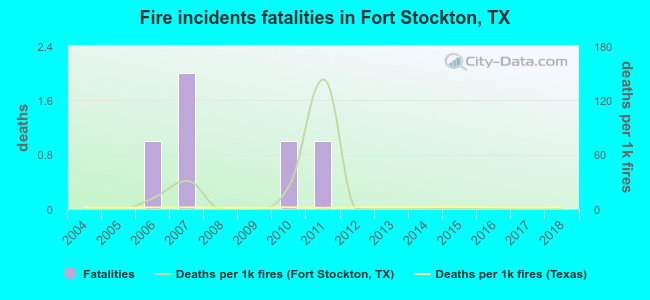 Based on the data from the years 2004 - 2018 the average number of fire-related yearly deaths is 0. The highest number of reported deaths - 2 took place in 2007, and the lowest - 0 in 2004. The data has a constant trend.
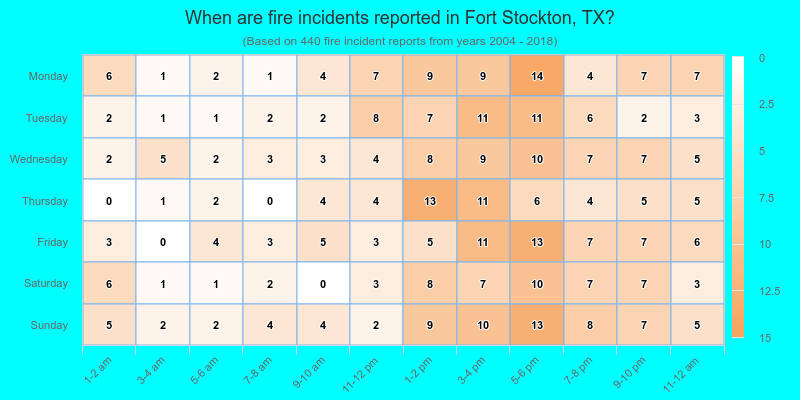
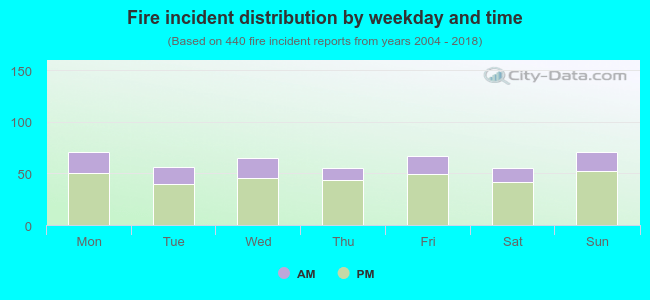 26.6% incidents where reported in the morning and 73.4% in the evening. The most fires (16.1%) took place on Monday, and the least (12.5%) on Thursday.
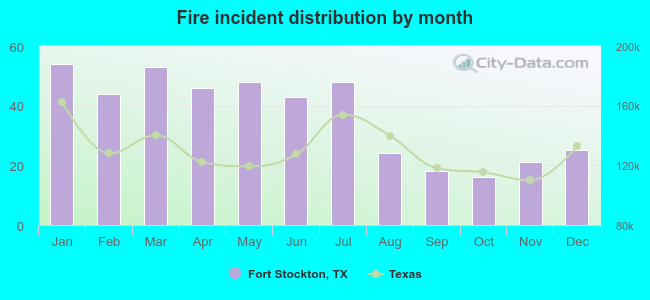 Based on the 440 incident reports from years 2004 - 2018 most fires (12.3%) took place during January, and the least (3.6%) in October.
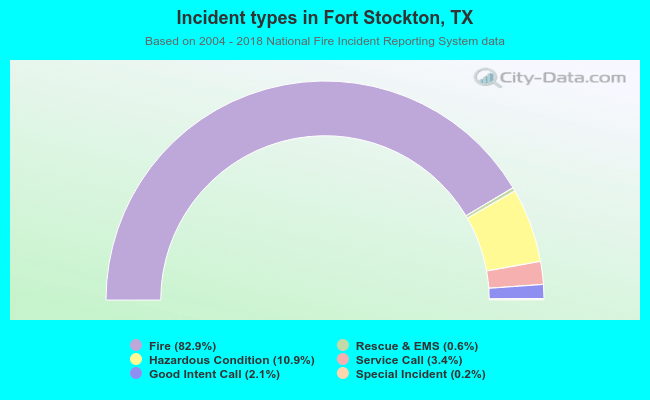 Out of all 531 cases reported during the years 2004 - 2018, the most belonged to the categories: Fire (82.9%), Rescue & EMS (10.9%), and Hazardous Condition (3.4%).
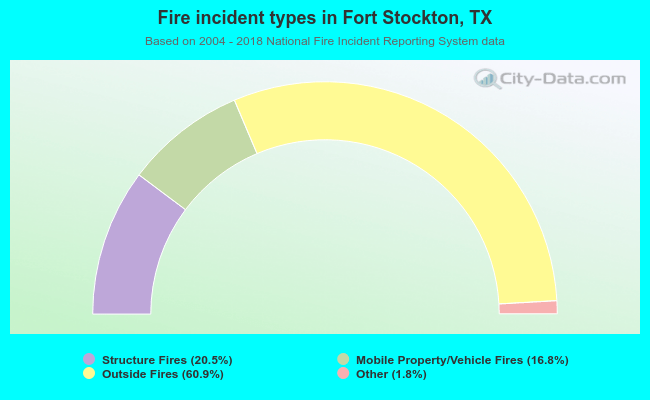 When looking into fire subcategories, the most incidents belonged to: Outside Fires (60.9%), and Structure Fires (20.5%).