Odessa: Fire Incidents, Texas (TX)
Where are fire incidents reported in Odessa, TX
Something went wrong! Please refresh the page.
| Fire incidents reported | |
|---|---|
| Sreet name | Count |
| 42ND ST | 372 |
| 8TH ST | 274 |
| UNIVERSITY BLVD | 248 |
| DIXIE BLVD | 222 |
| ANDREWS HWY | 216 |
| GRANDVIEW AVE | 206 |
| COUNTY ROAD WEST | 188 |
| 10TH ST | 168 |
| GOLDER AVE | 156 |
| OAKWOOD DR | 150 |
| 2ND ST | 126 |
| 11TH ST | 124 |
| 16TH ST | 118 |
| TANGLEWOOD LN | 114 |
| 338 LO | 112 |
| 14TH ST | 108 |
| TEXAS AVE | 108 |
| 52ND ST | 106 |
| MURPHY ST | 98 |
| PENBROOK ST | 96 |
| EAST RIDGE RD | 94 |
| 15TH ST | 92 |
| 13TH ST | 84 |
| 23RD ST | 80 |
| INTERSTATE 20 | 80 |
| 57TH ST | 78 |
| CLEMENTS ST | 76 |
| UNIVERSITY | 76 |
| MONAHANS ST | 72 |
| 3RD ST | 70 |
| Other | 5,633 |
2003 - 2018 National Fire Incident Reporting System (NFIRS) incidents
- Incident types reported to NFIRS in Odessa, TX
- 61,22566.9%Rescue & EMS
- 9,74510.6%Fire
- 7,2848.0%Good Intent Call
- 6,3036.9%Hazardous Condition
- 4,2184.6%Service Call
- 2,5872.8%False Alarm
- 980.1%Special Incident
- Fire incident types reported to NFIRS in Odessa, TX
- 4,84849.7%Outside Fires
- 3,33834.3%Structure Fires
- 1,24212.7%Mobile Property/Vehicle Fires
- 3173.3%Other
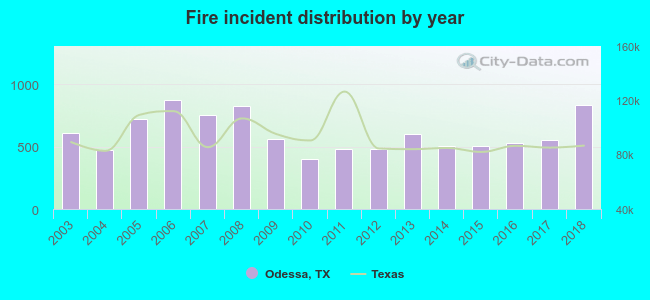 Based on the data from the years 2003 - 2018 the average number of fire incidents per year is 607. The highest number of reported fires - 872 took place in 2006, and the least - 405 in 2010. The data has a rising trend.
The average number of yearly fire incidents per 10k residents in Odessa, TX compared to nearest cities:
(Note: Based on data for the last 3 years, including only cities with population 5,000 and above)
| Odessa: | 55.7 |
| West Odessa: | 36.0 |
| Midland: | 23.6 |
| Andrews: | 141.4 |
| Monahans: | 22.3 |
| Big Spring: | 67.3 |
| Seminole: | 2.8 |
| Lamesa: | 108.8 |
| Fort Stockton: | 9.4 |
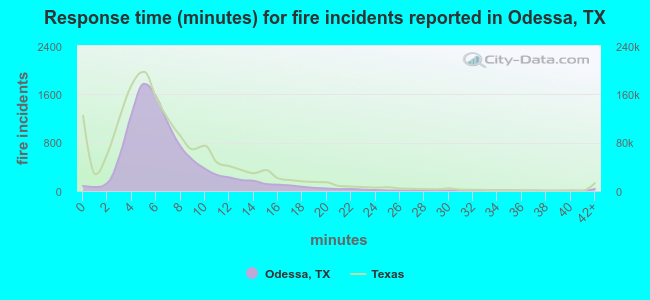 The median response time based on all reported fire incidents is 6 minutes. This is close to the state median value.
The median response time in Odessa, TX compared to nearest cities:
(Note: Based on data for all years, including only cities with at least 500 fire incidents)
| Odessa: | 6 minutes |
| Midland: | 6 minutes |
| Andrews: | 13 minutes |
| Monahans: | 5 minutes |
| Jal: | 15 minutes |
| Big Spring: | 7 minutes |
| Eunice: | 11 minutes |
| Lamesa: | 6 minutes |
| Hobbs: | 5 minutes |
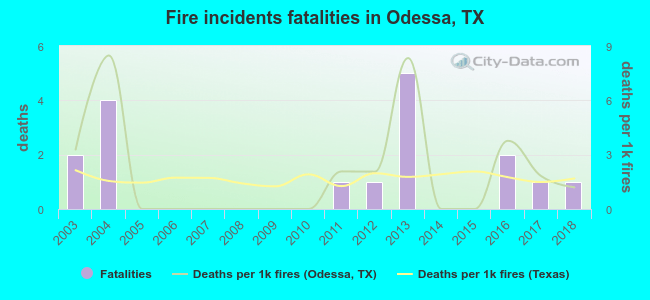 According to the reports from the years 2003 - 2018 the average number of fire-related yearly deaths is 1. The highest number of deaths - 5 took place in 2013, and the lowest - 0 in 2005. The data has a decreasing trend.
The average number of fatalities per 1,000 fires is 2. This indicator was the highest - 8 in 2004, and the lowest 0 in 2005. The trend for fatalities per 1,000 fires is declining. Compared to the state value the number of deaths per 1,000 incidents is similar.
According to the reports from the years 2003 - 2018 the average number of fire-related yearly deaths is 1. The highest number of deaths - 5 took place in 2013, and the lowest - 0 in 2005. The data has a decreasing trend.
The average number of fatalities per 1,000 fires is 2. This indicator was the highest - 8 in 2004, and the lowest 0 in 2005. The trend for fatalities per 1,000 fires is declining. Compared to the state value the number of deaths per 1,000 incidents is similar.Deaths per 1,000 incidents in Odessa, TX compared to nearest cities:
(Note: Based on data for all years, including only cities with at least 2,500 fire incidents)
| Odessa: | 1.7 |
| Midland: | 4.0 |
| Andrews: | 1.1 |
| Big Spring: | 0.7 |
| Hobbs: | 1.3 |
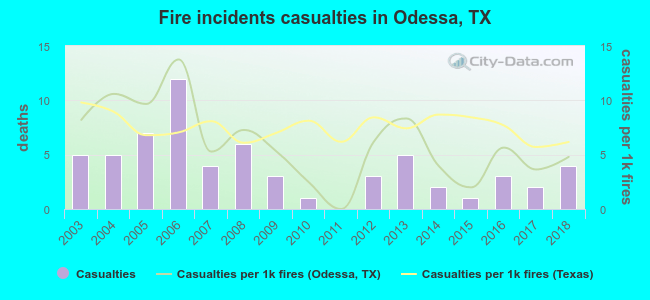 Based on the reports from the years 2003 - 2018 the average number of fire-related yearly casualties is 4. The highest number of reported injuries - 12 took place in 2006, and the lowest - 0 in 2011. The data has a dropping trend.
The average number of injuries per 1,000 fires is 6. This indicator was the highest - 14 in 2006, and the lowest 0 in 2011. The trend for injuries per 1,000 fires is dropping. Compared to the state value the number of injuries per 1,000 fires is about the same.
Based on the reports from the years 2003 - 2018 the average number of fire-related yearly casualties is 4. The highest number of reported injuries - 12 took place in 2006, and the lowest - 0 in 2011. The data has a dropping trend.
The average number of injuries per 1,000 fires is 6. This indicator was the highest - 14 in 2006, and the lowest 0 in 2011. The trend for injuries per 1,000 fires is dropping. Compared to the state value the number of injuries per 1,000 fires is about the same.
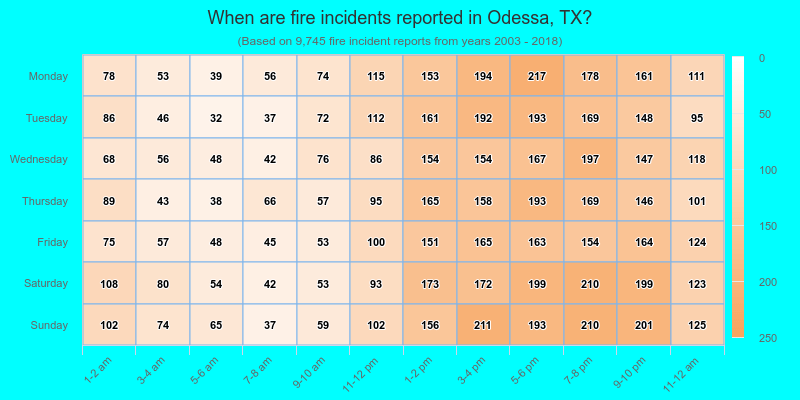
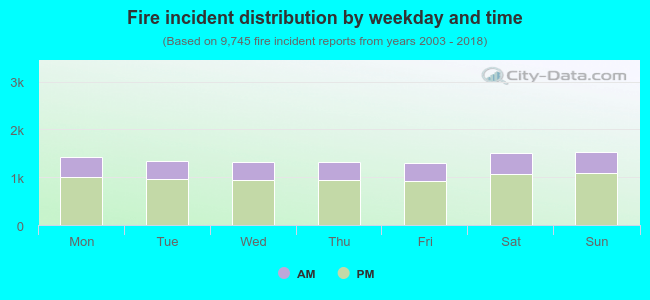 28.8% incidents where reported in the morning and 71.2% in the evening. The most fires (15.8%) took place on Sunday, and the least (13.3%) on Friday.
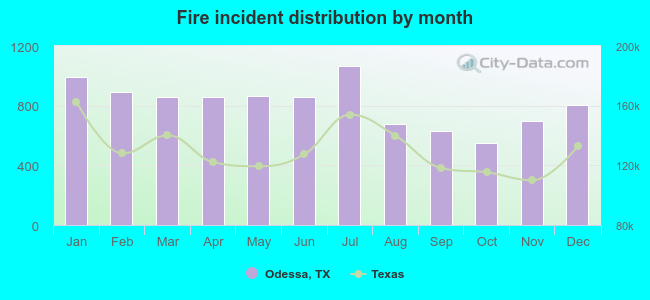 According to the 9,745 reports from years 2003 - 2018 most fires (10.9%) took place during July, and the least (5.7%) in October.
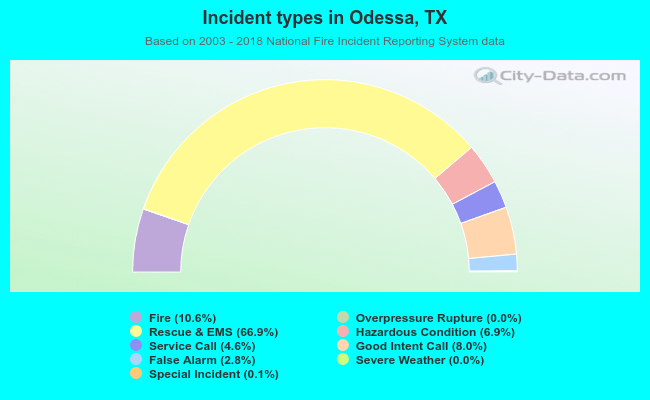 Out of all 91,535 cases reported during the years 2003 - 2018, the most belonged to the categories: Rescue & EMS (66.9%), Fire (10.6%), and Good Intent Call (8.0%).
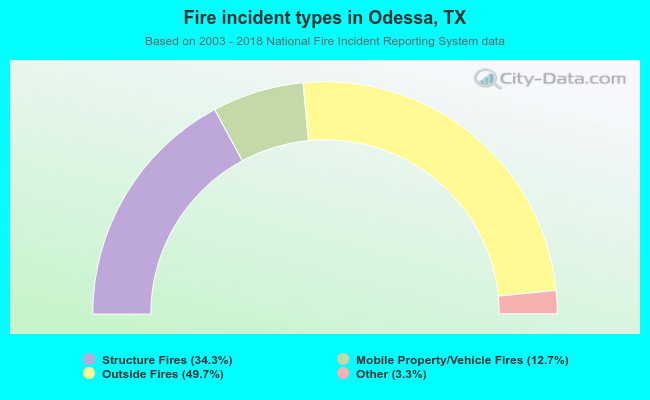 When looking into fire subcategories, the most reports belonged to: Outside Fires (49.7%), and Structure Fires (34.3%).