Fostoria: Fire Incidents, Ohio (OH)
Where are fire incidents reported in Fostoria, OH
Something went wrong! Please refresh the page.
| Fire incidents reported | |
|---|---|
| Sreet name | Count |
| COUNTYLINE ST | 92 |
| MAIN ST | 90 |
| POPLAR ST | 62 |
| UNION ST | 58 |
| SANDUSKY ST | 52 |
| TIFFIN ST | 52 |
| SPRUCE ST | 46 |
| CENTER ST | 44 |
| US 23 | 44 |
| COLUMBUS AVE | 42 |
| LYTLE ST | 42 |
| FREMONT ST | 40 |
| TOWN ST | 38 |
| MCDOUGAL ST | 34 |
| LYNN ST | 32 |
| US 224 | 30 |
| SR 12 | 28 |
| VINE ST | 28 |
| CROCKER ST | 26 |
| NORTH ST | 24 |
| ST. RT. 587 | 24 |
| SUMMIT ST | 22 |
| BEIER DR | 20 |
| BUCKLEY ST | 20 |
| CO. RD. 18 | 20 |
| ST. RT. 18 | 20 |
| CO RD 28 RD | 18 |
| CO RD 592 | 18 |
| SOUTH ST | 18 |
| SR 18 | 18 |
| Other | 330 |
2002 - 2018 National Fire Incident Reporting System (NFIRS) incidents
- Incident types reported to NFIRS in Fostoria, OH
- 10,79071.5%Rescue & EMS
- 1,4329.5%Fire
- 1,1307.5%Hazardous Condition
- 9096.0%Service Call
- 3722.5%Good Intent Call
- 3522.3%False Alarm
- 480.3%Special Incident
- 280.2%Severe Weather
- 220.1%Overpressure Rupture
- Fire incident types reported to NFIRS in Fostoria, OH
- 63244.1%Structure Fires
- 56739.6%Outside Fires
- 20514.3%Mobile Property/Vehicle Fires
- 282.0%Other
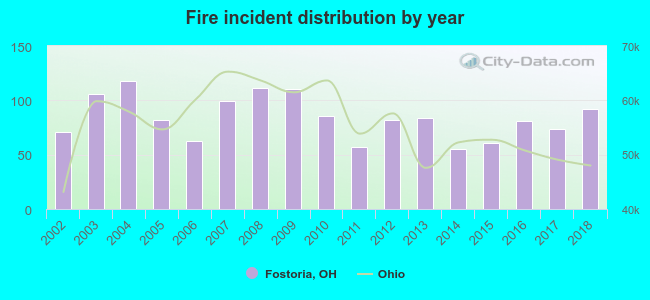 Based on the data from the years 2002 - 2018 the average number of fires per year is 84. The highest number of reported fire incidents - 118 took place in 2004, and the least - 55 in 2014. The data has a rising trend.
The average number of yearly fire incidents per 10k residents in Fostoria, OH compared to nearest cities:
(Note: Based on data for the last 3 years, including only cities with population 5,000 and above)
| Fostoria: | 62.5 |
| Tiffin: | 61.1 |
| Findlay: | 28.9 |
| Bowling Green: | 23.2 |
| Fremont: | 66.5 |
| Upper Sandusky: | 82.3 |
| Clyde: | 56.5 |
| Waterville: | 43.5 |
| Perrysburg: | 46.6 |
 The median response time based on all reported fire incidents is 4 minutes. This is lower compared to the Ohio median value.
The median response time in Fostoria, OH compared to nearest cities:
(Note: Based on data for all years, including only cities with at least 500 fire incidents)
| Fostoria: | 4 minutes |
| Tiffin: | 4 minutes |
| Findlay: | 6 minutes |
| Bowling Green: | 6 minutes |
| Fremont: | 4 minutes |
| Upper Sandusky: | 7 minutes |
| Clyde: | 6 minutes |
| Forest: | 11 minutes |
| Oak Harbor: | 8 minutes |
 Based on the reports from the years 2002 - 2018 the average number of fire-related yearly deaths is 1. The highest number of deaths - 6 took place in 2017, and the lowest - 0 in 2003. The data has a decreasing trend.
 Based on the reports from the years 2002 - 2018 the average number of fire-related yearly casualties is 1. The highest number of reported injuries - 9 took place in 2004, and the lowest - 0 in 2005. The data has a decreasing trend.
The average number of casualties per 1,000 fire incidents is 14. This indicator was the highest - 85 in 2002, and the lowest 0 in 2005. The trend for injuries per 1,000 incidents is decreasing. Compared to the Ohio value the number of injuries per 1,000 fires is similar.
Based on the reports from the years 2002 - 2018 the average number of fire-related yearly casualties is 1. The highest number of reported injuries - 9 took place in 2004, and the lowest - 0 in 2005. The data has a decreasing trend.
The average number of casualties per 1,000 fire incidents is 14. This indicator was the highest - 85 in 2002, and the lowest 0 in 2005. The trend for injuries per 1,000 incidents is decreasing. Compared to the Ohio value the number of injuries per 1,000 fires is similar.Casualties per 1,000 incidents in Fostoria, OH compared to nearest cities:
(Note: Based on data for all years, including only cities with at least 500 fire incidents)
| Fostoria: | 14.7 |
| Tiffin: | 4.6 |
| Findlay: | 25.8 |
| Bowling Green: | 3.5 |
| Fremont: | 21.2 |
| Upper Sandusky: | 4.9 |
| Clyde: | 14.0 |
| Forest: | 1.7 |
| Oak Harbor: | 2.3 |
 31.3% incidents where reported in the morning and 68.7% in the evening. The most fires (16.1%) took place on Monday, and the least (11.9%) on Tuesday.
 According to the 1,432 incident reports from years 2002 - 2018 most fires (13.3%) took place during July, and the least (6.2%) in December.
 Out of all 15,083 cases reported during the years 2002 - 2018, the most belonged to the categories: Rescue & EMS (71.5%), Fire (9.5%), and Hazardous Condition (7.5%).
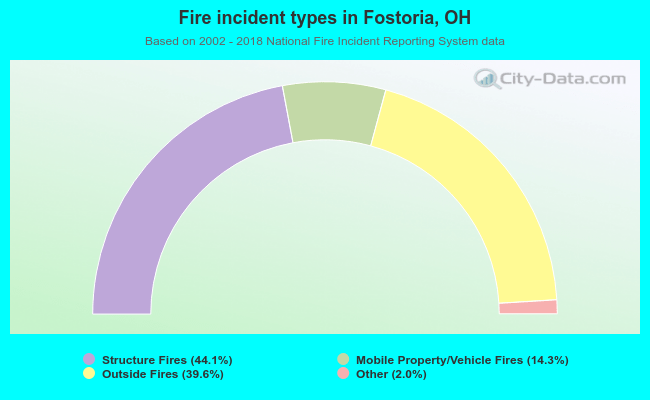 When looking into fire subcategories, the most incidents belonged to: Structure Fires (44.1%), and Outside Fires (39.6%).