Findlay: Fire Incidents, Ohio (OH)
Where are fire incidents reported in Findlay, OH
Something went wrong! Please refresh the page.
| Fire incidents reported | |
|---|---|
| Sreet name | Count |
| MAIN ST | 212 |
| TIFFIN AVE | 118 |
| BLANCHARD ST | 80 |
| LIMA AVE | 68 |
| SANDUSKY ST | 62 |
| TRENTON AVE | 50 |
| SR 12 | 48 |
| US 224 | 46 |
| CR 220 | 44 |
| CR 140 | 40 |
| BRIGHT RD | 38 |
| CR 236 | 36 |
| TR 108 | 36 |
| MAIN CROSS ST | 32 |
| CR 18 | 30 |
| INDUSTRIAL DR | 30 |
| MAIN | 30 |
| I75 | 28 |
| FOSTORIA AVE | 26 |
| INTERSTATE 75 (EAGLE TWP) | 26 |
| LIMA ST | 26 |
| PARK ST | 26 |
| CENTER ST | 24 |
| CHERRY ST | 24 |
| CRYSTAL AVE | 24 |
| I-75 | 24 |
| BERNARD AVE | 22 |
| INTERSTATE 75EAGLE TWP | 22 |
| STERLING HILL DR | 22 |
| TIFFIN | 22 |
| Other | 934 |
2002 - 2018 National Fire Incident Reporting System (NFIRS) incidents
- Incident types reported to NFIRS in Findlay, OH
- 7,36849.8%Rescue & EMS
- 2,25015.2%Fire
- 2,19414.8%Hazardous Condition
- 1,1217.6%False Alarm
- 9496.4%Good Intent Call
- 8575.8%Service Call
- 220.1%Special Incident
- Fire incident types reported to NFIRS in Findlay, OH
- 1,03245.9%Structure Fires
- 85638.0%Outside Fires
- 35615.8%Mobile Property/Vehicle Fires
- 60.3%Other
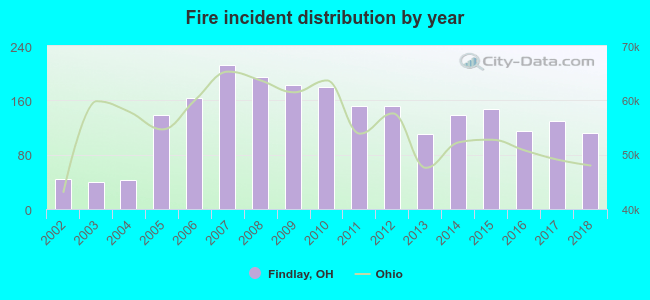 Based on the data from the years 2002 - 2018 the average number of fires per year is 132. The highest number of reported fire incidents - 212 took place in 2007, and the least - 40 in 2003. The data has a rising trend.
The average number of yearly fire incidents per 10k residents in Findlay, OH compared to nearest cities:
(Note: Based on data for the last 3 years, including only cities with population 5,000 and above)
| Findlay: | 28.9 |
| Fostoria: | 62.5 |
| Ada: | 49.7 |
| Bowling Green: | 23.2 |
| Upper Sandusky: | 82.3 |
| Tiffin: | 61.1 |
| Kenton: | 112.4 |
 The median response time based on all reported fire incidents is 6 minutes. This is about the same as the Ohio median value.
The median response time in Findlay, OH compared to nearest cities:
(Note: Based on data for all years, including only cities with at least 500 fire incidents)
| Findlay: | 6 minutes |
| Fostoria: | 4 minutes |
| Forest: | 11 minutes |
| Ottawa: | 7 minutes |
| Bowling Green: | 6 minutes |
| Upper Sandusky: | 7 minutes |
| Tiffin: | 4 minutes |
| Harrod: | 8 minutes |
| Kenton: | 6 minutes |
 Based on the reports from the years 2002 - 2018 the average number of fire-related yearly deaths is 1. The highest number of deaths - 3 took place in 2006, and the lowest - 0 in 2002. The data has an increasing trend.
 Based on the reports from the years 2002 - 2018 the average number of fire-related yearly casualties is 3. The highest number of reported injuries - 11 took place in 2010, and the lowest - 0 in 2002. The data has an increasing trend.
The average number of casualties per 1,000 fire incidents is 22. This indicator was the highest - 66 in 2012, and the lowest 0 in 2002. The trend for injuries per 1,000 incidents is increasing. Compared to the Ohio value the number of injuries per 1,000 fires is higher.
Based on the reports from the years 2002 - 2018 the average number of fire-related yearly casualties is 3. The highest number of reported injuries - 11 took place in 2010, and the lowest - 0 in 2002. The data has an increasing trend.
The average number of casualties per 1,000 fire incidents is 22. This indicator was the highest - 66 in 2012, and the lowest 0 in 2002. The trend for injuries per 1,000 incidents is increasing. Compared to the Ohio value the number of injuries per 1,000 fires is higher.Casualties per 1,000 incidents in Findlay, OH compared to nearest cities:
(Note: Based on data for all years, including only cities with at least 500 fire incidents)
| Findlay: | 25.8 |
| Fostoria: | 14.7 |
| Forest: | 1.7 |
| Ottawa: | 3.4 |
| Bowling Green: | 3.5 |
| Upper Sandusky: | 4.9 |
| Tiffin: | 4.6 |
| Harrod: | 1.7 |
| Kenton: | 19.1 |
 31.9% incidents where reported in the morning and 68.1% in the evening. The most fires (15.5%) took place on Sunday, and the least (12.6%) on Thursday.
 According to the 2,250 reports from years 2002 - 2018 most fires (11.1%) took place during April, and the least (6.3%) in January.
 Out of all 14,785 cases reported during the years 2002 - 2018, the most belonged to the categories: Rescue & EMS (49.8%), Fire (15.2%), and Hazardous Condition (14.8%).
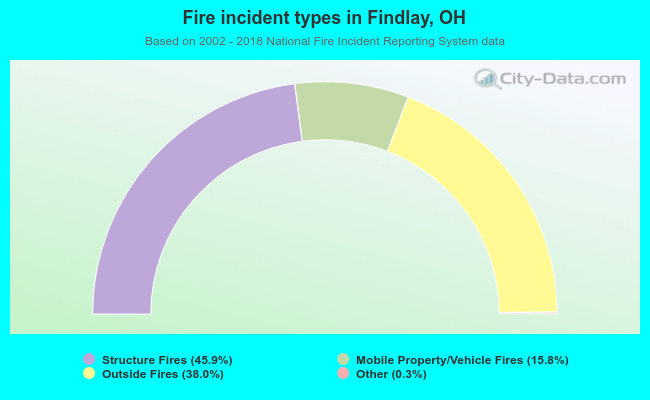 When looking into fire subcategories, the most reports belonged to: Structure Fires (45.9%), and Outside Fires (38.0%).