Frankfort: Fire Incidents, Kentucky (KY)
Where are fire incidents reported in Frankfort, KY
Something went wrong! Please refresh the page.
| Fire incidents reported | |
|---|---|
| Sreet name | Count |
| LAWRENCEBURG RD | 132 |
| VERSAILLES RD | 74 |
| HOLMES ST | 72 |
| MAIN ST | 72 |
| LEONARDWOOD DR | 50 |
| GEORGETOWN RD | 46 |
| LEAWOOD DR | 46 |
| SCHENKEL LN | 46 |
| LANDINGS DR | 44 |
| INTERSTATE 64 | 42 |
| LOUISVILLE RD | 42 |
| WILKINSON BLVD | 42 |
| JOHN DAVIS DR | 30 |
| LIMESTONE DR | 28 |
| BALD KNOB RD | 26 |
| OWENTON RD | 26 |
| SUNSET DR | 24 |
| HICKORY DR | 22 |
| KINGS DAUGHTERS DR | 22 |
| U.S. 127 SOUTH | 22 |
| MURRAY ST | 20 |
| OWENTON AVE | 20 |
| SECOND ST | 20 |
| U.S. 127 | 20 |
| UNIVERSITY DR | 20 |
| WALLACE AVE | 20 |
| CENTENNIAL AVE | 18 |
| HANNA PL | 18 |
| MARLOWE CT | 18 |
| PARKSIDE DR | 18 |
| Other | 1,309 |
2002 - 2018 National Fire Incident Reporting System (NFIRS) incidents
- Incident types reported to NFIRS in Frankfort, KY
- 7,19747.4%Rescue & EMS
- 2,40915.9%Fire
- 1,55610.3%Hazardous Condition
- 1,4799.7%False Alarm
- 1,2958.5%Good Intent Call
- 9776.4%Service Call
- 1210.8%Special Incident
- 830.5%Severe Weather
- 600.4%Overpressure Rupture
- Fire incident types reported to NFIRS in Frankfort, KY
- 1,07044.4%Outside Fires
- 70429.2%Structure Fires
- 39516.4%Mobile Property/Vehicle Fires
- 24010.0%Other
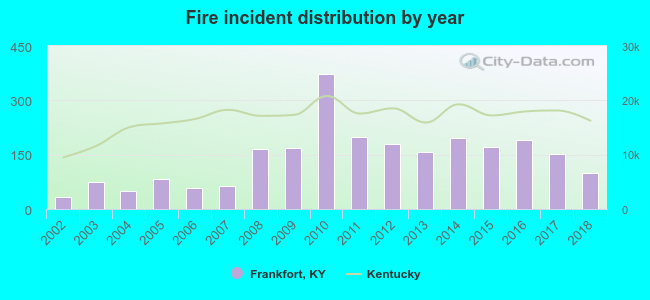 Based on the data from the years 2002 - 2018 the average number of fire incidents per year is 142. The highest number of fires - 373 took place in 2010, and the least - 33 in 2002. The data has a rising trend.
The average number of yearly fire incidents per 10k residents in Frankfort, KY compared to nearest cities:
(Note: Based on data for the last 3 years, including only cities with population 5,000 and above)
| Frankfort: | 53.7 |
| Lawrenceburg: | 40.6 |
| Versailles: | 83.2 |
| Georgetown: | 39.4 |
| Shelbyville: | 82.3 |
| Wilmore: | 12.5 |
| Nicholasville: | 62.1 |
| Harrodsburg: | 106.4 |
| Paris: | 76.3 |
 The median response time based on all reported fire incidents is 6 minutes. This is similar to the state median value.
The median response time in Frankfort, KY compared to nearest cities:
(Note: Based on data for all years, including only cities with at least 500 fire incidents)
| Frankfort: | 6 minutes |
| Versailles: | 4 minutes |
| Georgetown: | 5 minutes |
| Shelbyville: | 6 minutes |
| Owenton: | 11 minutes |
| Corinth: | 16 minutes |
| Simpsonville: | 7 minutes |
| Nicholasville: | 6 minutes |
| Harrodsburg: | 6 minutes |
 According to the reports from the years 2002 - 2018 the average number of fire-related fatalities per year is 0. The highest number of reported deaths - 1 took place in 2003, and the lowest - 0 in 2002. The data has a constant trend.
 Based on the data from the years 2002 - 2018 the average number of fire-related yearly casualties is 2. The highest number of reported injuries - 10 took place in 2010, and the lowest - 0 in 2002. The data has a constant trend.
The average number of injuries per 1,000 fire incidents is 9. This indicator was the highest - 27 in 2010, and the lowest 0 in 2002. The trend for casualties per 1,000 incidents is dropping. Compared to the state value the number of injuries per 1,000 fire incidents is higher.
Based on the data from the years 2002 - 2018 the average number of fire-related yearly casualties is 2. The highest number of reported injuries - 10 took place in 2010, and the lowest - 0 in 2002. The data has a constant trend.
The average number of injuries per 1,000 fire incidents is 9. This indicator was the highest - 27 in 2010, and the lowest 0 in 2002. The trend for casualties per 1,000 incidents is dropping. Compared to the state value the number of injuries per 1,000 fire incidents is higher.Casualties per 1,000 incidents in Frankfort, KY compared to nearest cities:
(Note: Based on data for all years, including only cities with at least 500 fire incidents)
| Frankfort: | 12.5 |
| Versailles: | 3.8 |
| Georgetown: | 10.4 |
| Shelbyville: | 15.3 |
| Owenton: | 0.0 |
| Corinth: | 1.9 |
| Simpsonville: | 0.0 |
| Nicholasville: | 15.5 |
| Harrodsburg: | 4.1 |
 29.6% incidents where reported in the morning and 70.4% in the evening. The most fires (15.1%) took place on Saturday, and the least (13.6%) on Monday.
 Based on the 2,409 reports from years 2002 - 2018 most fires (11.3%) took place during April, and the least (6.1%) in December.
 Out of all 15,177 cases reported during the years 2002 - 2018, the most belonged to the categories: Rescue & EMS (47.4%), Fire (15.9%), and Hazardous Condition (10.3%).
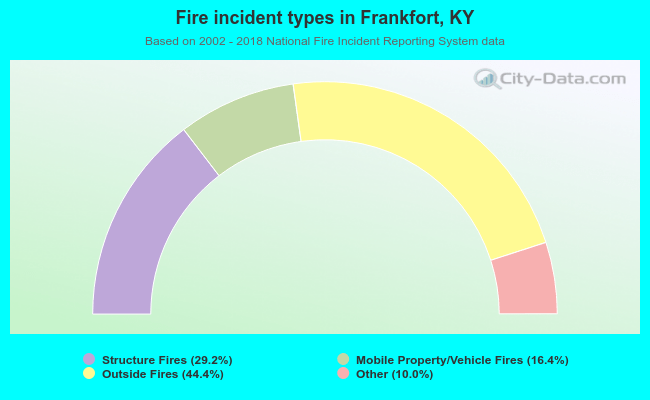 When looking into fire subcategories, the most incidents belonged to: Outside Fires (44.4%), and Structure Fires (29.2%).