Nicholasville: Fire Incidents, Kentucky (KY)
Where are fire incidents reported in Nicholasville, KY
Something went wrong! Please refresh the page.
| Fire incidents reported | |
|---|---|
| Sreet name | Count |
| MAIN ST | 380 |
| BRANNON RD | 80 |
| UNION MILL RD | 76 |
| LEXINGTON RD | 74 |
| SULPHER WELL RD | 72 |
| KEENE RD | 68 |
| US 27 | 66 |
| EDGEWOOD DR | 54 |
| VINCE RD | 54 |
| HARTLEY DR | 50 |
| TATES CREEK PIKE | 50 |
| WILMORE RD | 50 |
| SHUN PIKE | 42 |
| HIGH BRIDGE RD | 40 |
| LOGANA PIKE | 40 |
| MAPLE ST | 40 |
| YOUNG DR | 40 |
| MCDOWELL DR | 38 |
| HARRODSBURG RD | 36 |
| BROWN ST | 34 |
| CATNIP HILL RD | 34 |
| ETHEL DR | 34 |
| CENTRAL AVE | 30 |
| FOXWOOD DR | 30 |
| GRIFFIN DR | 30 |
| STEPHENS DR | 30 |
| JESSAMINE STATION RD | 28 |
| MILES RD | 28 |
| PINOAK DR | 28 |
| CHRISMAN MILL RD | 26 |
| Other | 770 |
2004 - 2018 National Fire Incident Reporting System (NFIRS) incidents
- Incident types reported to NFIRS in Nicholasville, KY
- 4,75234.2%Rescue & EMS
- 2,45217.6%Fire
- 2,14215.4%Service Call
- 1,67612.1%Hazardous Condition
- 1,60411.5%Good Intent Call
- 1,1498.3%False Alarm
- 760.5%Special Incident
- 260.2%Overpressure Rupture
- 190.1%Severe Weather
- Fire incident types reported to NFIRS in Nicholasville, KY
- 1,07343.8%Outside Fires
- 88936.3%Structure Fires
- 37715.4%Mobile Property/Vehicle Fires
- 1134.6%Other
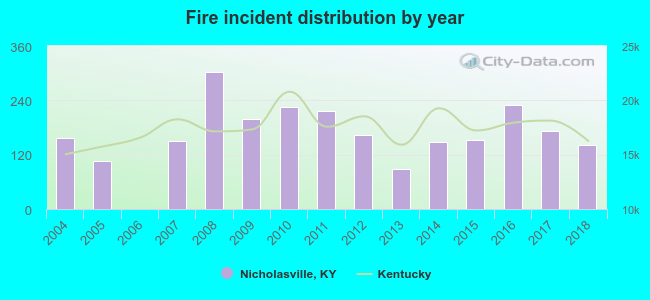 According to the data from the years 2004 - 2018 the average number of fires per year is 163. The highest number of reported fire incidents - 302 took place in 2008, and the least - 1 in 2006. The data has a declining trend.
The average number of yearly fire incidents per 10k residents in Nicholasville, KY compared to nearest cities:
(Note: Based on data for the last 3 years, including only cities with population 5,000 and above)
| Nicholasville: | 62.1 |
| Wilmore: | 12.5 |
| Versailles: | 83.2 |
| Harrodsburg: | 106.4 |
| Richmond: | 89.8 |
| Danville: | 54.6 |
| Lawrenceburg: | 40.6 |
| Winchester: | 95.6 |
| Georgetown: | 39.4 |
 The median response time based on all reported fire incidents is 6 minutes. This is about the same as the Kentucky median value.
The median response time in Nicholasville, KY compared to nearest cities:
(Note: Based on data for all years, including only cities with at least 500 fire incidents)
| Nicholasville: | 6 minutes |
| Versailles: | 4 minutes |
| Harrodsburg: | 6 minutes |
| Richmond: | 7 minutes |
| Lancaster: | 10 minutes |
| Danville: | 5 minutes |
| Winchester: | 5 minutes |
| Georgetown: | 5 minutes |
| Stanford: | 11 minutes |
 According to the reports from the years 2004 - 2018 the average number of fire-related casualties per year is 3. The highest number of casualties - 7 took place in 2009, and the lowest - 0 in 2004. The data has a growing trend.
The average number of casualties per 1,000 fires is 14. This indicator was the highest - 43 in 2018, and the lowest 0 in 2004. The trend for casualties per 1,000 incidents is rising. Compared to the state value the number of casualties per 1,000 fires is much higher.
According to the reports from the years 2004 - 2018 the average number of fire-related casualties per year is 3. The highest number of casualties - 7 took place in 2009, and the lowest - 0 in 2004. The data has a growing trend.
The average number of casualties per 1,000 fires is 14. This indicator was the highest - 43 in 2018, and the lowest 0 in 2004. The trend for casualties per 1,000 incidents is rising. Compared to the state value the number of casualties per 1,000 fires is much higher.Casualties per 1,000 incidents in Nicholasville, KY compared to nearest cities:
(Note: Based on data for all years, including only cities with at least 500 fire incidents)
| Nicholasville: | 15.5 |
| Versailles: | 3.8 |
| Harrodsburg: | 4.1 |
| Richmond: | 10.4 |
| Lancaster: | 1.2 |
| Danville: | 7.2 |
| Winchester: | 5.9 |
| Georgetown: | 10.4 |
| Stanford: | 2.6 |
 27.4% incidents where reported in the morning and 72.6% in the evening. The most fires (15.3%) took place on Tuesday, and the least (12.5%) on Thursday.
 According to the 2,452 fire incident reports from years 2004 - 2018 most fires (10.3%) took place during September, and the least (5.3%) in December.
 Out of all 13,896 cases reported during the years 2004 - 2018, the most belonged to the categories: Rescue & EMS (34.2%), Fire (17.6%), and Service Call (15.4%).
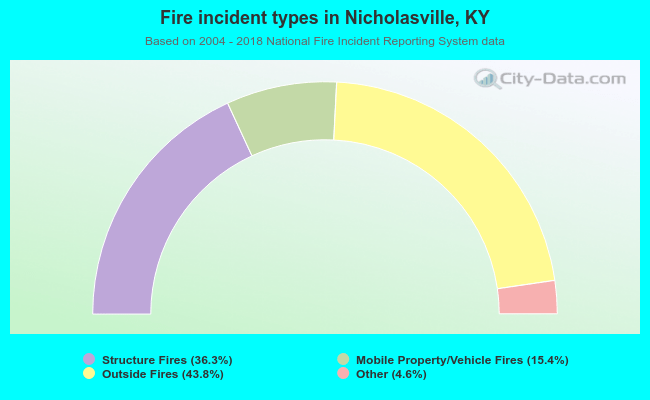 When looking into fire subcategories, the most reports belonged to: Outside Fires (43.8%), and Structure Fires (36.3%).