Franklin Lakes: Fire Incidents, New Jersey (NJ)
Where are fire incidents reported in Franklin Lakes, NJ
Something went wrong! Please refresh the page.
|
| |||||||||||||||||||||||||||||||||||||||||||||||||||||||||||||||||||||||||||||||||||||||||||||||||||||||||||||
2003 - 2018 National Fire Incident Reporting System (NFIRS) incidents
- Incident types reported to NFIRS in Franklin Lakes, NJ
- 1,02338.3%False Alarm
- 75728.3%Hazardous Condition
- 43516.3%Fire
- 2398.9%Service Call
- 1716.4%Good Intent Call
- 411.5%Rescue & EMS
- Fire incident types reported to NFIRS in Franklin Lakes, NJ
- 24857.0%Structure Fires
- 9722.3%Outside Fires
- 6314.5%Mobile Property/Vehicle Fires
- 276.2%Other
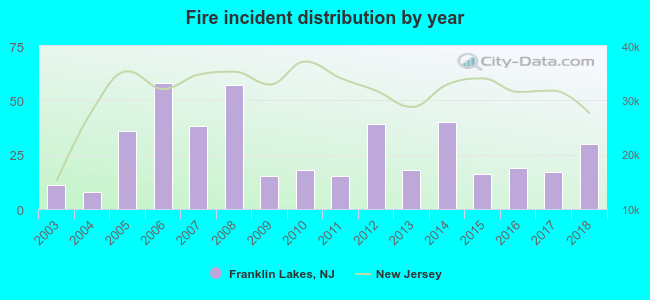 According to the data from the years 2003 - 2018 the average number of fire incidents per year is 27. The highest number of reported fire incidents - 58 took place in 2006, and the least - 8 in 2004. The data has a growing trend.
The average number of yearly fire incidents per 10k residents in Franklin Lakes, NJ compared to nearest cities:
(Note: Based on data for the last 3 years, including only cities with population 5,000 and above)
| Franklin Lakes: | 20.3 |
| Oakland: | 19.9 |
| Wyckoff: | 51.7 |
| North Haledon: | 30.5 |
| Midland Park: | 19.6 |
| Pompton Lakes: | 14.9 |
| Allendale: | 31.9 |
| Waldwick: | 16.8 |
| Hawthorne: | 15.5 |
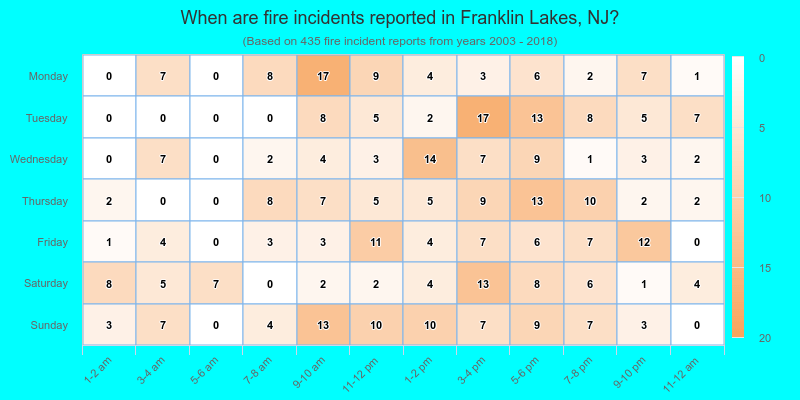
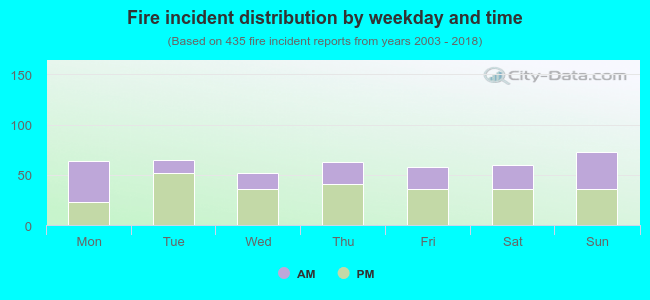 40.2% incidents where reported in the morning and 59.8% in the evening. The most fires (16.8%) took place on Sunday, and the least (12.0%) on Wednesday.
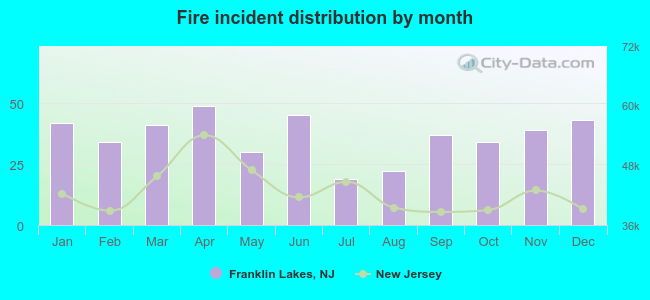 Based on the 435 fire incident reports from years 2003 - 2018 most fires (11.3%) took place during April, and the least (4.4%) in July.
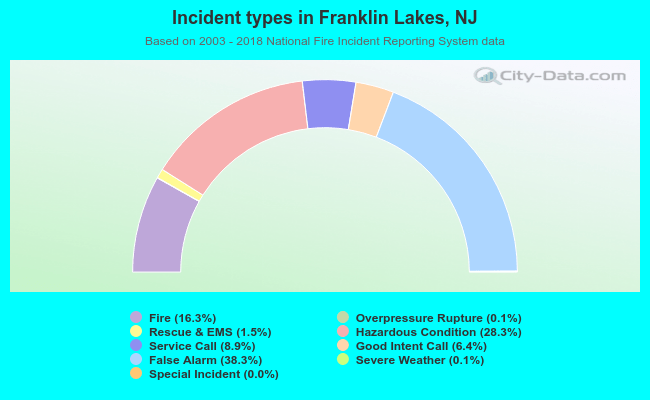 Out of all 2,671 cases reported during the years 2003 - 2018, the most belonged to the categories: False Alarm (38.3%), Hazardous Condition (28.3%), and Fire (16.3%).
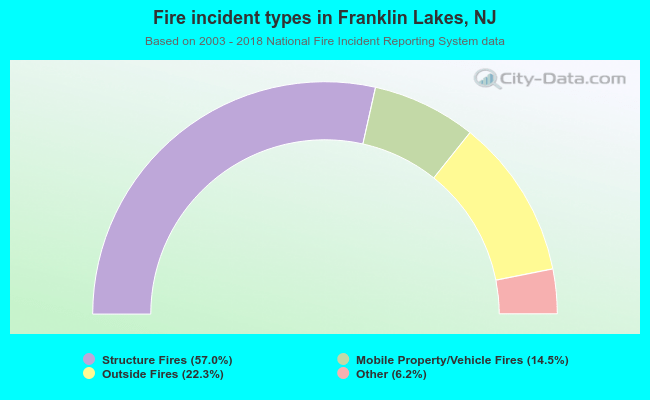 When looking into fire subcategories, the most incidents belonged to: Structure Fires (57.0%), and Outside Fires (22.3%).