Pompton Lakes: Fire Incidents, New Jersey (NJ)
Where are fire incidents reported in Pompton Lakes, NJ
Something went wrong! Please refresh the page.
|
| |||||||||||||||||||||||||||||||||||||||||||||||||||||||||||||||||||||||||||||||||||||||||||||||||||||||||||||
2004 - 2018 National Fire Incident Reporting System (NFIRS) incidents
- Incident types reported to NFIRS in Pompton Lakes, NJ
- 45633.8%Hazardous Condition
- 36827.3%False Alarm
- 24217.9%Fire
- 1269.3%Good Intent Call
- 856.3%Service Call
- 695.1%Rescue & EMS
- 20.1%Overpressure Rupture
- Fire incident types reported to NFIRS in Pompton Lakes, NJ
- 12551.7%Structure Fires
- 8635.5%Outside Fires
- 208.3%Mobile Property/Vehicle Fires
- 114.5%Other
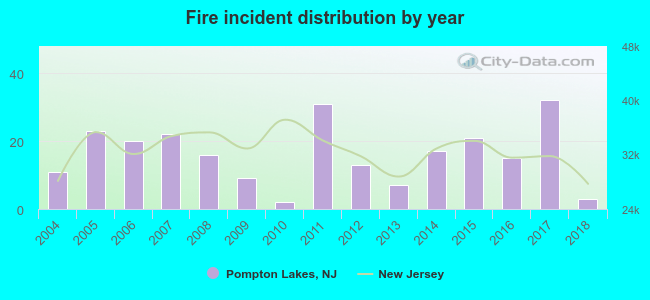 According to the data from the years 2004 - 2018 the average number of fires per year is 16. The highest number of fires - 32 took place in 2017, and the least - 2 in 2010. The data has a decreasing trend.
The average number of yearly fire incidents per 10k residents in Pompton Lakes, NJ compared to nearest cities:
(Note: Based on data for the last 3 years, including only cities with population 5,000 and above)
| Pompton Lakes: | 14.9 |
| Bloomingdale: | 25.3 |
| Wanaque: | 16.9 |
| Butler: | 16.5 |
| Oakland: | 19.9 |
| Franklin Lakes: | 20.3 |
| Wayne: | 12.5 |
| Kinnelon: | 32.8 |
| Lincoln Park: | 7.6 |
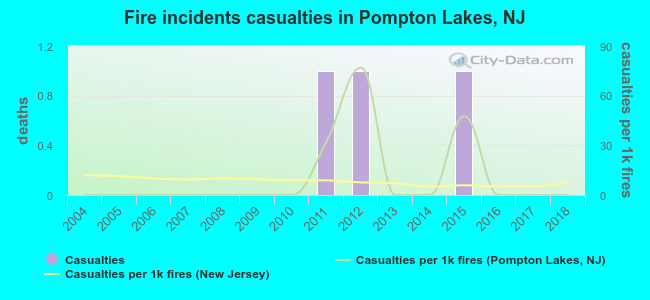 According to the reports from the years 2004 - 2018 the average number of fire-related yearly casualties is 0. The highest number of reported casualties - 1 took place in 2011, and the lowest - 0 in 2004. The data has a constant trend.
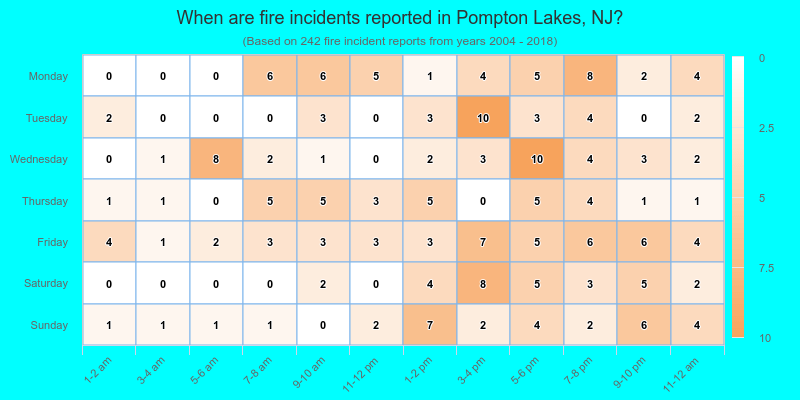
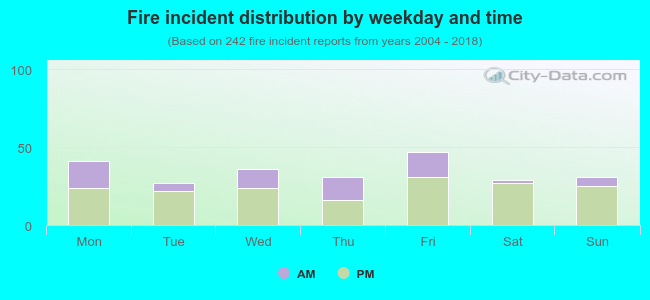 30.2% incidents where reported in the morning and 69.8% in the evening. The most fires (19.4%) took place on Friday, and the least (11.2%) on Tuesday.
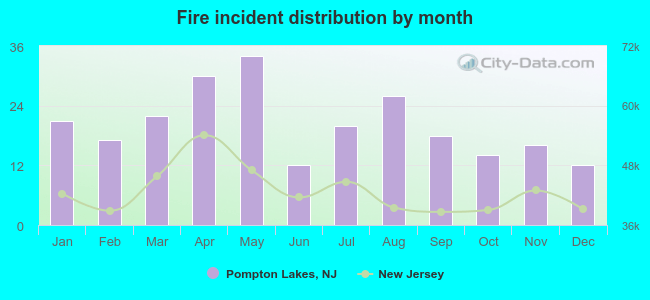 According to the 242 fires from years 2004 - 2018 most fires (14.0%) took place during May, and the least (5.0%) in June.
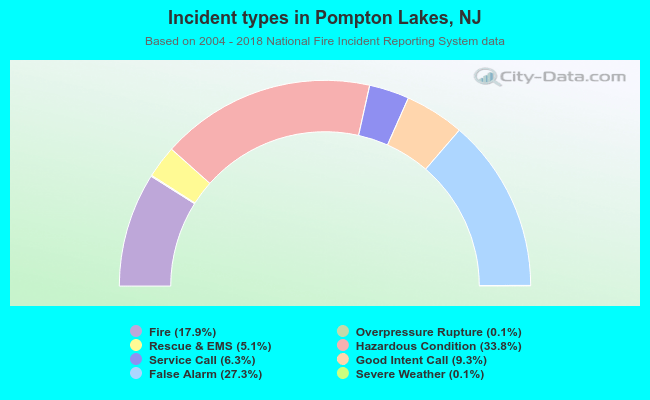 Out of all 1,349 cases reported during the years 2004 - 2018, the most belonged to the categories: Hazardous Condition (33.8%), False Alarm (27.3%), and Fire (17.9%).
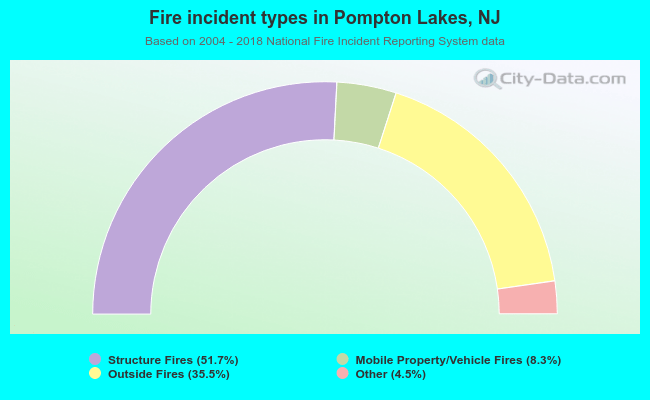 When looking into fire subcategories, the most incidents belonged to: Structure Fires (51.7%), and Outside Fires (35.5%).