Franklin: Fire Incidents, New Hampshire (NH)
Where are fire incidents reported in Franklin, NH
Something went wrong! Please refresh the page.
| Fire incidents reported | |
|---|---|
| Sreet name | Count |
| CENTRAL STREET | 114 |
| CENTRAL ST | 96 |
| SOUTH MAIN STREET | 84 |
| HILL ROAD | 38 |
| SALISBURY ROAD | 30 |
| WEST BOW STREET | 30 |
| CHESTNUT STREET | 26 |
| PUNCH BROOK ROAD | 26 |
| PROSPECT STREET | 24 |
| PLEASANT STREET | 22 |
| HILL RD | 20 |
| SCHOOL ST | 20 |
| SCHOOL STREET | 20 |
| MAIN ST | 18 |
| PLEASANT ST | 18 |
| RIVER STREET | 18 |
| SALISBURY RD | 18 |
| WEBSTER LAKE ROAD | 18 |
| EVERGREEN AVENUE | 16 |
| VICTORY DRIVE | 16 |
| NORTH MAIN STREET | 14 |
| RANGE RD | 14 |
| TERRACE RD | 14 |
| BOW ST | 12 |
| CANAL ST | 12 |
| CHESTNUT ST | 12 |
| FRANKLIN | 12 |
| LAKE AVENUE | 12 |
| LAKE SHORE DRIVE | 12 |
| NEW HAMPTON ROAD | 12 |
| Other | 125 |
2005 - 2018 National Fire Incident Reporting System (NFIRS) incidents
- Incident types reported to NFIRS in Franklin, NH
- 5,11854.4%Rescue & EMS
- 1,37014.6%Hazardous Condition
- 9239.8%Fire
- 7738.2%Good Intent Call
- 7307.8%Service Call
- 4504.8%False Alarm
- 240.3%Severe Weather
- 170.2%Overpressure Rupture
- Fire incident types reported to NFIRS in Franklin, NH
- 56260.9%Structure Fires
- 22424.3%Outside Fires
- 768.2%Mobile Property/Vehicle Fires
- 616.6%Other
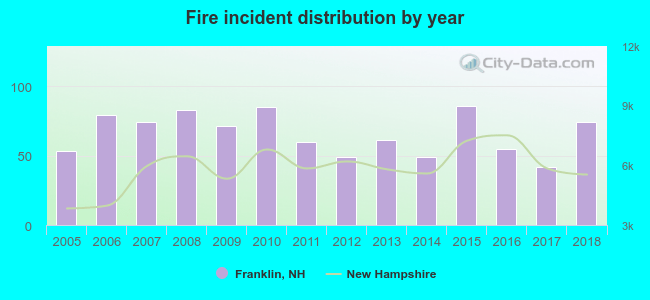 Based on the data from the years 2005 - 2018 the average number of fires per year is 66. The highest number of reported fires - 86 took place in 2015, and the least - 42 in 2017. The data has a growing trend.
The average number of yearly fire incidents per 10k residents in Franklin, NH compared to nearest cities:
(Note: Based on data for the last 3 years, including only cities with population 5,000 and above)
| Franklin: | 67.6 |
| Belmont: | 80.2 |
| Laconia: | 91.7 |
| Loudon: | 96.5 |
| Gilford: | 59.4 |
| Concord: | 41.9 |
| Hopkinton: | 66.8 |
| Alton: | 78.7 |
| Bow: | 72.7 |
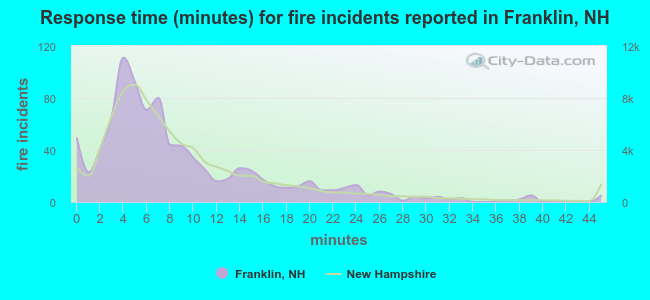 The median response time based on all reported fire incidents is 7 minutes. This is close to the New Hampshire median value.
The median response time in Franklin, NH compared to nearest cities:
(Note: Based on data for all years, including only cities with at least 500 fire incidents)
| Franklin: | 7 minutes |
| Northfield: | 8 minutes |
| Tilton: | 7 minutes |
| Sanbornton: | 12 minutes |
| Belmont: | 9 minutes |
| Laconia: | 6 minutes |
| Loudon: | 8 minutes |
| Gilford: | 8 minutes |
| Meredith: | 7 minutes |
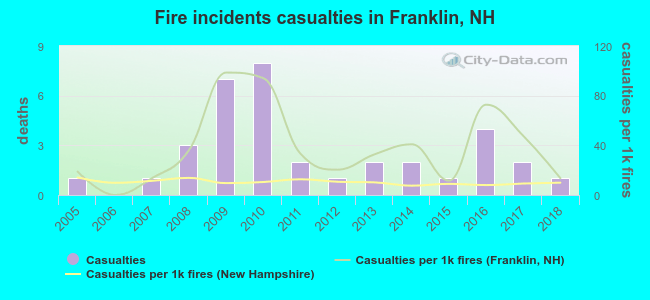 Based on the data from the years 2005 - 2018 the average number of fire-related casualties per year is 3. The highest number of casualties - 8 took place in 2010, and the lowest - 0 in 2006. The data has a constant trend.
The average number of casualties per 1,000 fire incidents is 38. This indicator was the highest - 99 in 2009, and the lowest 0 in 2006. The trend for casualties per 1,000 incidents is dropping. Compared to the state value the number of casualties per 1,000 fire incidents is much higher.
Based on the data from the years 2005 - 2018 the average number of fire-related casualties per year is 3. The highest number of casualties - 8 took place in 2010, and the lowest - 0 in 2006. The data has a constant trend.
The average number of casualties per 1,000 fire incidents is 38. This indicator was the highest - 99 in 2009, and the lowest 0 in 2006. The trend for casualties per 1,000 incidents is dropping. Compared to the state value the number of casualties per 1,000 fire incidents is much higher.Casualties per 1,000 incidents in Franklin, NH compared to nearest cities:
(Note: Based on data for all years, including only cities with at least 500 fire incidents)
| Franklin: | 37.9 |
| Northfield: | 20.7 |
| Tilton: | 5.3 |
| Sanbornton: | 28.6 |
| Belmont: | 39.7 |
| Laconia: | 17.4 |
| Loudon: | 3.0 |
| Gilford: | 3.8 |
| Meredith: | 4.6 |
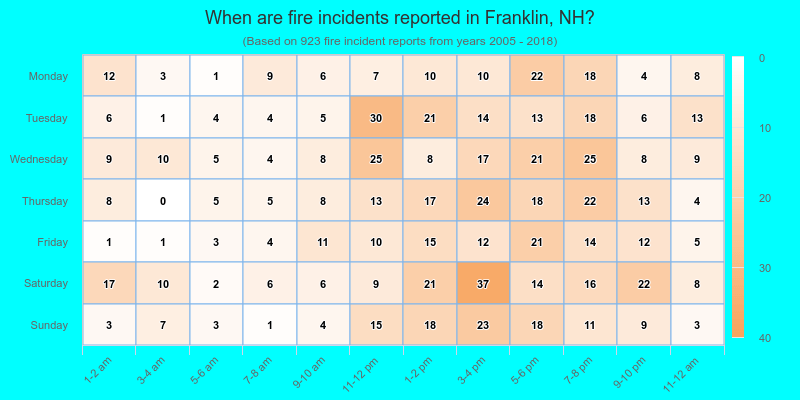
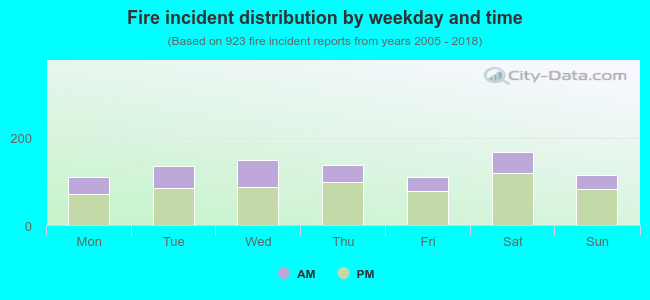 32.6% incidents where reported in the morning and 67.4% in the evening. The most fires (18.2%) took place on Saturday, and the least (11.8%) on Friday.
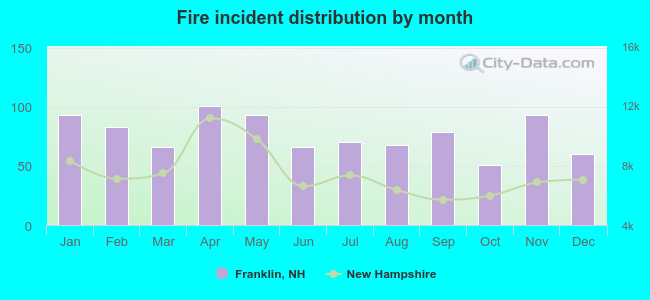 According to the 923 fire incidents from years 2005 - 2018 most fires (10.9%) took place during April, and the least (5.5%) in October.
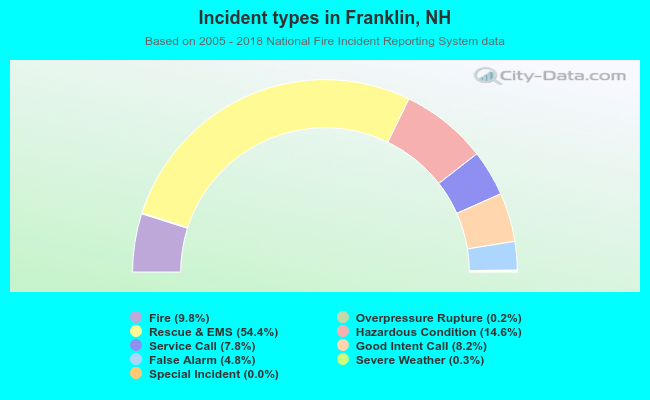 Out of all 9,409 cases reported during the years 2005 - 2018, the most belonged to the categories: Rescue & EMS (54.4%), Hazardous Condition (14.6%), and Fire (9.8%).
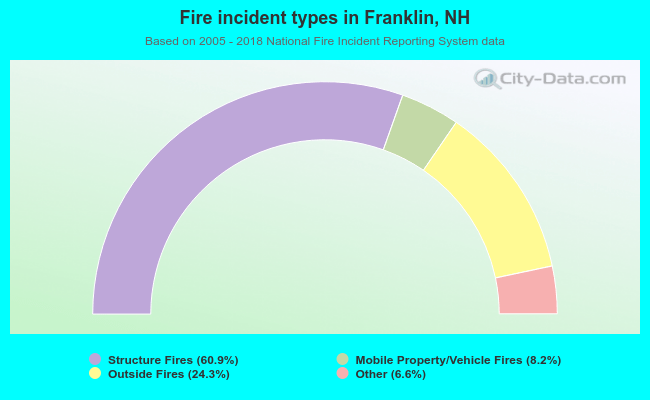 When looking into fire subcategories, the most incidents belonged to: Structure Fires (60.9%), and Outside Fires (24.3%).