Concord: Fire Incidents, New Hampshire (NH)
Where are fire incidents reported in Concord, NH
Something went wrong! Please refresh the page.
| Fire incidents reported | |
|---|---|
| Sreet name | Count |
| LOUDON RD | 436 |
| STATE ST | 212 |
| PLEASANT ST | 164 |
| FISHERVILLE RD | 116 |
| I 93 | 110 |
| MAIN ST | 110 |
| STORRS ST | 108 |
| MANCHESTER ST | 102 |
| FORT EDDY RD | 92 |
| HALL ST | 70 |
| LOUDON RD | 66 |
| PLEASANT ST | 64 |
| EAST SIDE DR | 62 |
| COMMERCIAL ST | 52 |
| CLINTON ST | 50 |
| SHEEP DAVIS RD | 50 |
| SOUTH ST | 50 |
| GARVINS FALLS RD | 48 |
| SILK FARM RD | 44 |
| RUMFORD ST | 40 |
| VILLAGE ST | 40 |
| DAMANTE DR | 38 |
| LONG POND RD | 38 |
| WARREN ST | 38 |
| PORTSMOUTH ST | 36 |
| MANCHESTER ST | 34 |
| SCHOOL ST | 34 |
| BOG RD | 32 |
| I 89 | 32 |
| PERLEY ST | 32 |
| Other | 379 |
2002 - 2018 National Fire Incident Reporting System (NFIRS) incidents
- Incident types reported to NFIRS in Concord, NH
- 23,66958.3%Rescue & EMS
- 3,9789.8%Service Call
- 3,8349.4%False Alarm
- 3,5378.7%Hazardous Condition
- 2,7796.8%Fire
- 2,6396.5%Good Intent Call
- 780.2%Overpressure Rupture
- 750.2%Severe Weather
- Fire incident types reported to NFIRS in Concord, NH
- 1,40750.6%Structure Fires
- 96034.5%Outside Fires
- 35812.9%Mobile Property/Vehicle Fires
- 541.9%Other
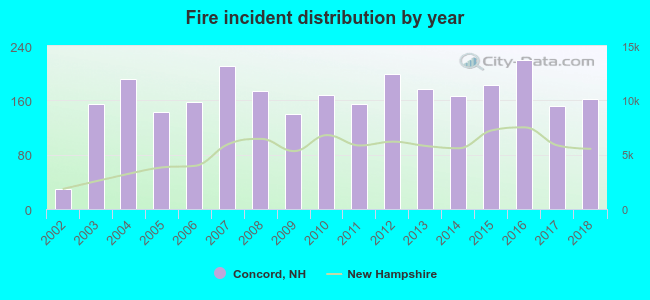 According to the data from the years 2002 - 2018 the average number of fires per year is 163. The highest number of fires - 219 took place in 2016, and the least - 29 in 2002. The data has a growing trend.
The average number of yearly fire incidents per 10k residents in Concord, NH compared to nearest cities:
(Note: Based on data for the last 3 years, including only cities with population 5,000 and above)
| Concord: | 41.9 |
| Bow: | 72.7 |
| Pembroke: | 20.6 |
| Hopkinton: | 66.8 |
| Loudon: | 96.5 |
| Weare: | 58.1 |
| Goffstown: | 31.5 |
| Franklin: | 67.6 |
| Manchester: | 27.2 |
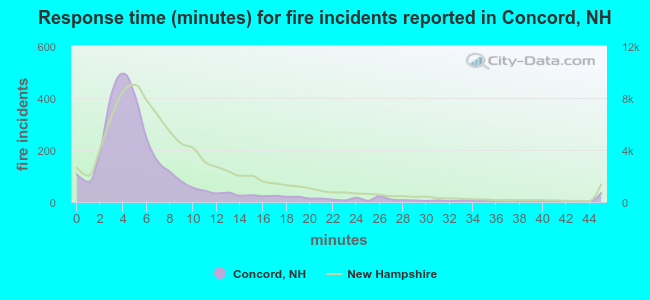 The median response time based on all reported fire incidents is 5 minutes. This is lower than the state median value.
The median response time in Concord, NH compared to nearest cities:
(Note: Based on data for all years, including only cities with at least 500 fire incidents)
| Concord: | 5 minutes |
| Bow: | 8 minutes |
| Hopkinton: | 9 minutes |
| Loudon: | 8 minutes |
| Hooksett: | 8 minutes |
| Epsom: | 10 minutes |
| Pittsfield: | 10 minutes |
| Weare: | 11 minutes |
| Northfield: | 8 minutes |
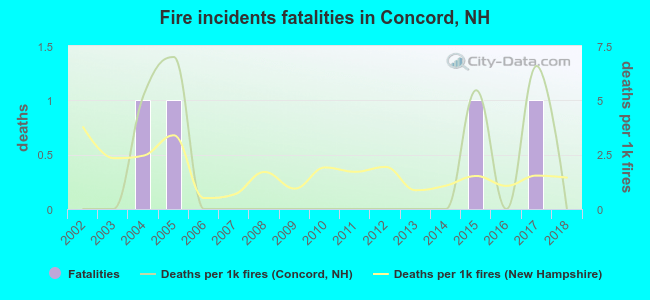 Based on the reports from the years 2002 - 2018 the average number of fire-related yearly deaths is 0. The highest number of reported deaths - 1 took place in 2004, and the lowest - 0 in 2002. The data has a constant trend.
The average number of deaths per 1,000 fire incidents is 1. This indicator was the highest - 7 in 2005, and the lowest 0 in 2002. The trend for fatalities per 1,000 fire incidents is constant. Compared to the state value the number of fatalities per 1,000 fires is similar.
Based on the reports from the years 2002 - 2018 the average number of fire-related yearly deaths is 0. The highest number of reported deaths - 1 took place in 2004, and the lowest - 0 in 2002. The data has a constant trend.
The average number of deaths per 1,000 fire incidents is 1. This indicator was the highest - 7 in 2005, and the lowest 0 in 2002. The trend for fatalities per 1,000 fire incidents is constant. Compared to the state value the number of fatalities per 1,000 fires is similar.Deaths per 1,000 incidents in Concord, NH compared to nearest cities:
(Note: Based on data for all years, including only cities with at least 2,500 fire incidents)
| Concord: | 1.4 |
| Manchester: | 2.3 |
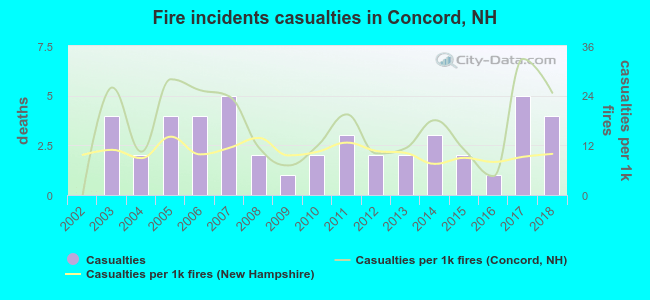 Based on the data from the years 2002 - 2018 the average number of fire-related yearly casualties is 3. The highest number of reported casualties - 5 took place in 2007, and the lowest - 0 in 2002. The data has an increasing trend.
The average number of casualties per 1,000 fire incidents is 16. This indicator was the highest - 33 in 2017, and the lowest 0 in 2002. The trend for casualties per 1,000 fire incidents is growing. Compared to the state value the number of casualties per 1,000 fire incidents is higher.
Based on the data from the years 2002 - 2018 the average number of fire-related yearly casualties is 3. The highest number of reported casualties - 5 took place in 2007, and the lowest - 0 in 2002. The data has an increasing trend.
The average number of casualties per 1,000 fire incidents is 16. This indicator was the highest - 33 in 2017, and the lowest 0 in 2002. The trend for casualties per 1,000 fire incidents is growing. Compared to the state value the number of casualties per 1,000 fire incidents is higher.Casualties per 1,000 incidents in Concord, NH compared to nearest cities:
(Note: Based on data for all years, including only cities with at least 500 fire incidents)
| Concord: | 16.6 |
| Bow: | 5.4 |
| Hopkinton: | 3.0 |
| Loudon: | 3.0 |
| Hooksett: | 11.8 |
| Epsom: | 2.0 |
| Pittsfield: | 22.3 |
| Weare: | 0.0 |
| Northfield: | 20.7 |
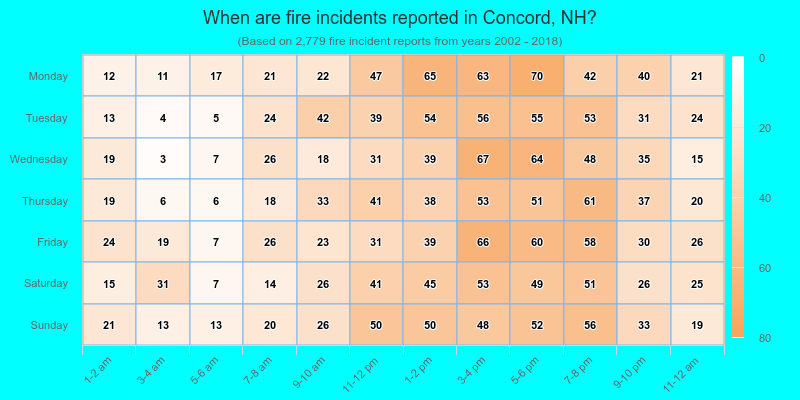
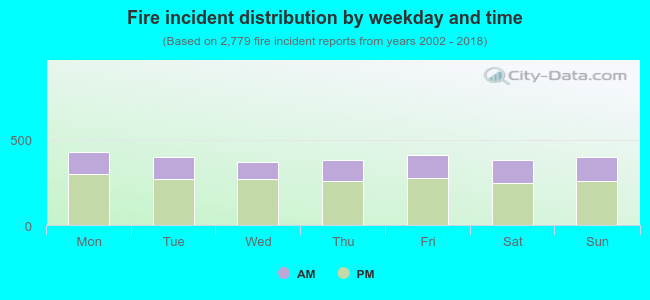 32.1% incidents where reported in the morning and 67.9% in the evening. The most fires (15.5%) took place on Monday, and the least (13.4%) on Wednesday.
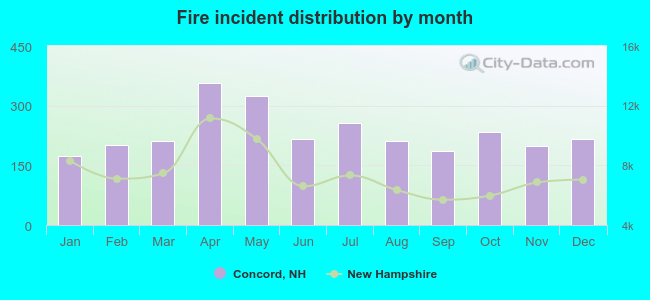 According to the 2,779 fires from years 2002 - 2018 most fires (12.8%) took place during April, and the least (6.3%) in January.
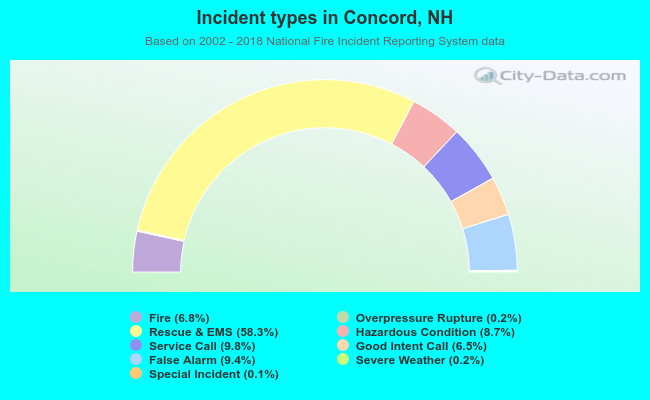 Out of all 40,615 cases reported during the years 2002 - 2018, the most belonged to the categories: Rescue & EMS (58.3%), Service Call (9.8%), and False Alarm (9.4%).
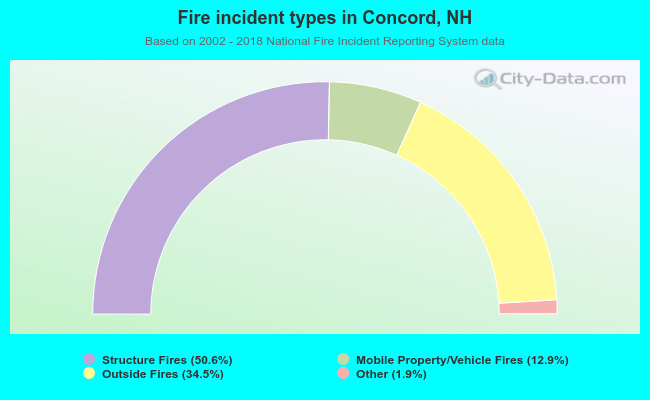 When looking into fire subcategories, the most incidents belonged to: Structure Fires (50.6%), and Outside Fires (34.5%).