Fremont: Fire Incidents, Indiana (IN)
Where are fire incidents reported in Fremont, IN
Something went wrong! Please refresh the page.
|
| |||||||||||||||||||||||||||||||||||||||||||||||||||||||||||||||||||||||||||||||||||||||||||||||||||||||||||||
| Other | 378 | |||||||||||||||||||||||||||||||||||||||||||||||||||||||||||||||||||||||||||||||||||||||||||||||||||||||||||||
2003 - 2017 National Fire Incident Reporting System (NFIRS) incidents
- Incident types reported to NFIRS in Fremont, IN
- 1,30042.3%Fire
- 73023.7%Rescue & EMS
- 51316.7%Hazardous Condition
- 2698.7%Service Call
- 1514.9%False Alarm
- 1033.3%Good Intent Call
- 100.3%Severe Weather
- Fire incident types reported to NFIRS in Fremont, IN
- 69453.4%Outside Fires
- 46936.1%Structure Fires
- 1088.3%Mobile Property/Vehicle Fires
- 292.2%Other
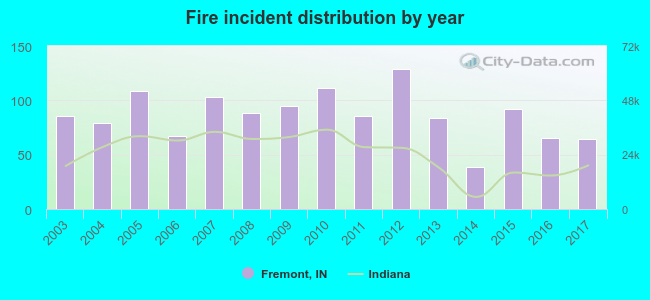 According to the data from the years 2003 - 2017 the average number of fire incidents per year is 86. The highest number of reported fire incidents - 129 took place in 2012, and the least - 39 in 2014. The data has a decreasing trend.
 The median response time based on all reported fire incidents is 8 minutes. This is higher than the state median value.
The median response time in Fremont, IN compared to nearest cities:
(Note: Based on data for all years, including only cities with at least 500 fire incidents)
| Fremont: | 8 minutes |
| Angola: | 8 minutes |
| Butler: | 10 minutes |
| Lagrange: | 11 minutes |
| Auburn: | 4 minutes |
| Kendallville: | 4 minutes |
| Shipshewana: | 11 minutes |
| Albion: | 10 minutes |
| Ligonier: | 8 minutes |
 According to the reports from the years 2003 - 2017 the average number of fire-related yearly deaths is 0. The highest number of reported deaths - 1 took place in 2007, and the lowest - 0 in 2003. The data has a constant trend.
 27.2% incidents where reported in the morning and 72.8% in the evening. The most fires (16.2%) took place on Saturday, and the least (11.5%) on Tuesday.
 According to the 1,300 fire incidents from years 2003 - 2017 most fires (17.7%) took place during April, and the least (4.7%) in September.
 Out of all 3,076 cases reported during the years 2003 - 2017, the most belonged to the categories: Fire (42.3%), Overpressure Rupture (23.7%), and Rescue & EMS (16.7%).
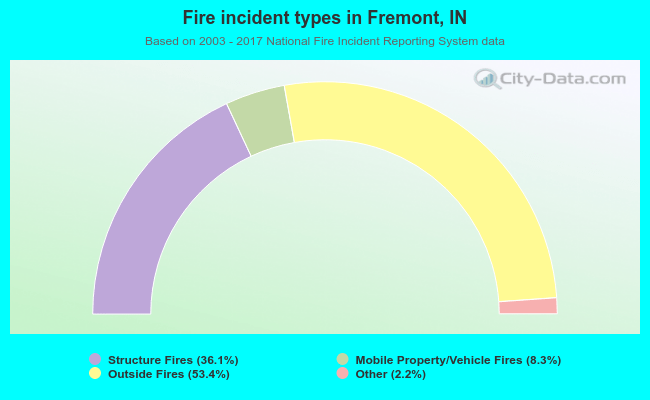 When looking into fire subcategories, the most incidents belonged to: Outside Fires (53.4%), and Structure Fires (36.1%).