Kendallville: Fire Incidents, Indiana (IN)
Where are fire incidents reported in Kendallville, IN
Something went wrong! Please refresh the page.
|
| |||||||||||||||||||||||||||||||||||||||||||||||||||||||||||||||||||||||||||||||||||||||||||||||||||||||||||||
2002 - 2017 National Fire Incident Reporting System (NFIRS) incidents
- Incident types reported to NFIRS in Kendallville, IN
- 98636.1%Fire
- 70825.9%Rescue & EMS
- 54720.0%Hazardous Condition
- 2559.3%Service Call
- 1485.4%False Alarm
- 752.7%Good Intent Call
- 100.4%Severe Weather
- Fire incident types reported to NFIRS in Kendallville, IN
- 52052.7%Structure Fires
- 28528.9%Outside Fires
- 13313.5%Mobile Property/Vehicle Fires
- 484.9%Other
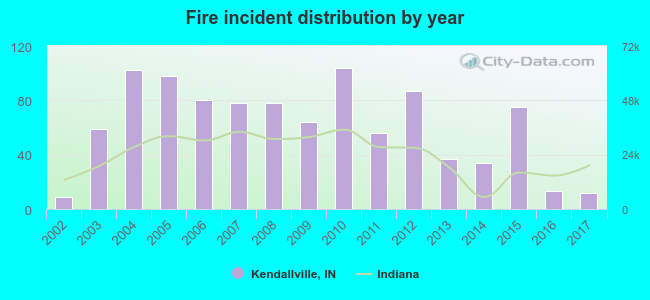 Based on the data from the years 2002 - 2017 the average number of fires per year is 62. The highest number of fire incidents - 104 took place in 2010, and the least - 9 in 2002. The data has an increasing trend.
The average number of yearly fire incidents per 10k residents in Kendallville, IN compared to nearest cities:
(Note: Based on data for the last 3 years, including only cities with population 5,000 and above)
| Kendallville: | 12.6 |
| Garrett: | 15.8 |
| Auburn: | 11.4 |
| Huntertown: | 16.8 |
| Angola: | 12.4 |
| Columbia City: | 56.6 |
| Fort Wayne: | 23.1 |
| New Haven: | 20.8 |
| Goshen: | 26.1 |
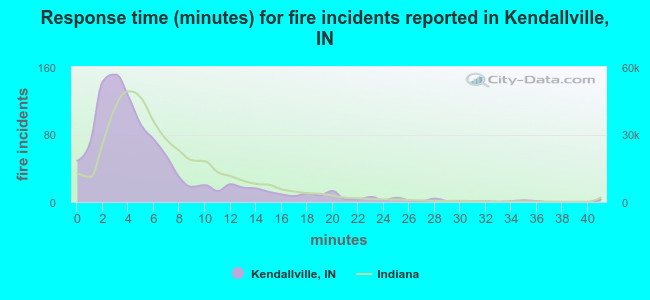 The median response time based on all reported fire incidents is 4 minutes. This is lower than the Indiana median value.
The median response time in Kendallville, IN compared to nearest cities:
(Note: Based on data for all years, including only cities with at least 500 fire incidents)
| Kendallville: | 4 minutes |
| Albion: | 10 minutes |
| Auburn: | 4 minutes |
| Lagrange: | 11 minutes |
| Ligonier: | 8 minutes |
| Angola: | 8 minutes |
| Butler: | 10 minutes |
| Columbia City: | 7 minutes |
| Shipshewana: | 11 minutes |
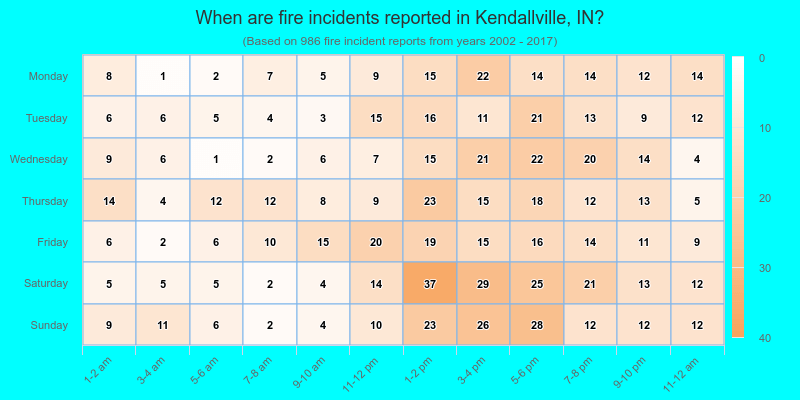
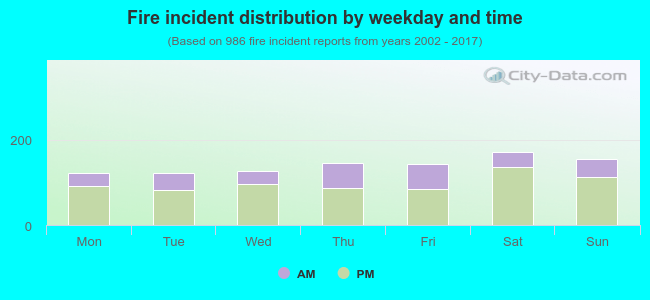 30.1% incidents where reported in the morning and 69.9% in the evening. The most fires (17.4%) took place on Saturday, and the least (12.3%) on Tuesday.
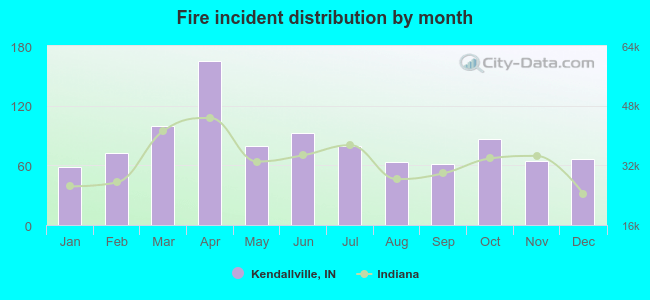 Based on the 986 fires from years 2002 - 2017 most fires (16.7%) took place during April, and the least (5.9%) in January.
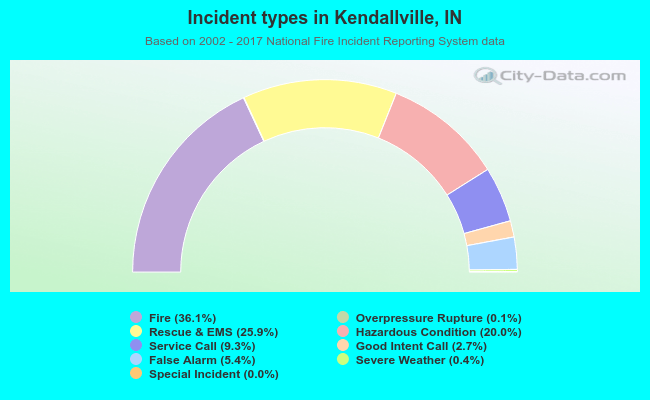 Out of all 2,732 cases reported during the years 2002 - 2017, the most belonged to the categories: Fire (36.1%), Rescue & EMS (25.9%), and Hazardous Condition (20.0%).
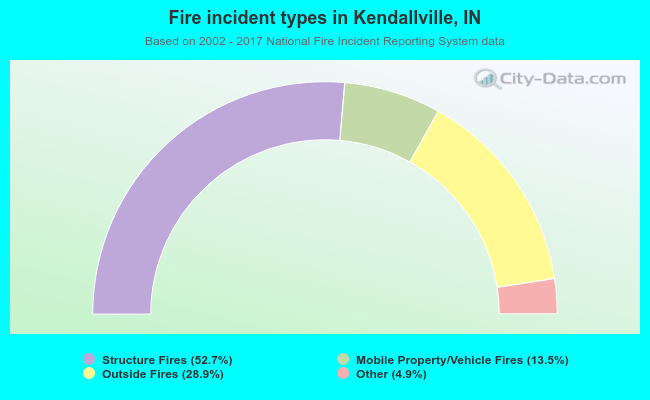 When looking into fire subcategories, the most incidents belonged to: Structure Fires (52.7%), and Outside Fires (28.9%).