Front Royal: Fire Incidents, Virginia (VA)
Where are fire incidents reported in Front Royal, VA
Something went wrong! Please refresh the page.
| Fire incidents reported | |
|---|---|
| Sreet name | Count |
| STRASBURG RD | 210 |
| ROYAL AVE | 186 |
| STONEWALL JACKSON HWY | 110 |
| WINCHESTER RD | 96 |
| JOHN MARSHALL HWY | 86 |
| ROCKLAND RD | 78 |
| COMMERCE AVE | 76 |
| CRISER RD | 74 |
| 14TH ST | 72 |
| SOUTH ST | 68 |
| PANHANDLE RD | 62 |
| SHENANDOAH AVE | 62 |
| DUCK ST | 60 |
| GUARD HILL RD | 56 |
| FAIRGROUND RD | 50 |
| HOWELLSVILLE RD | 50 |
| JAMES ST | 50 |
| MAIN ST | 50 |
| BLUE MOUNTAIN RD | 48 |
| INTERSTATE 66 - 0 TO 13 M | 48 |
| WESTERN LN | 48 |
| RIVERMONT DR | 46 |
| CATLETT MOUNTAIN RD | 44 |
| MANASSAS AVE | 44 |
| BROWNTOWN RD | 42 |
| RELIANCE RD | 42 |
| CHERRYDALE AVE | 40 |
| HAPPY CREEK RD | 40 |
| OSAGE ST | 40 |
| 11TH ST | 38 |
| Other | 1,758 |
2004 - 2018 National Fire Incident Reporting System (NFIRS) incidents
- Incident types reported to NFIRS in Front Royal, VA
- 11,02052.3%Rescue & EMS
- 3,77417.9%Fire
- 2,89513.7%Good Intent Call
- 1,3956.6%Hazardous Condition
- 1,0294.9%Service Call
- 8774.2%False Alarm
- 370.2%Severe Weather
- 320.2%Special Incident
- Fire incident types reported to NFIRS in Front Royal, VA
- 1,89550.2%Structure Fires
- 1,10929.4%Outside Fires
- 39310.4%Other
- 37710.0%Mobile Property/Vehicle Fires
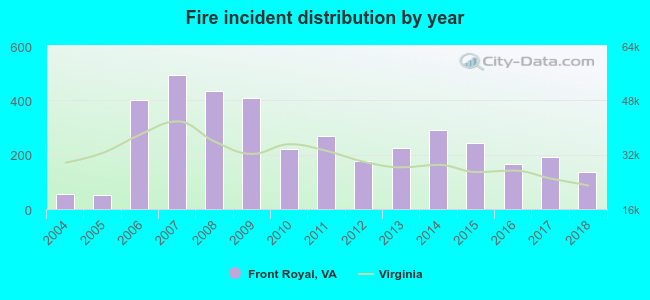 According to the data from the years 2004 - 2018 the average number of fires per year is 251. The highest number of reported fire incidents - 495 took place in 2007, and the least - 52 in 2005. The data has a rising trend.
The average number of yearly fire incidents per 10k residents in Front Royal, VA compared to nearest cities:
(Note: Based on data for the last 3 years, including only cities with population 5,000 and above)
| Front Royal: | 108.4 |
| Strasburg: | 42.2 |
| Winchester: | 71.2 |
| Woodstock: | 77.8 |
| Warrenton: | 105.3 |
| Purcellville: | 67.2 |
| Gainesville: | 42.1 |
| Culpeper: | 77.0 |
| Stone Ridge: | 1.4 |
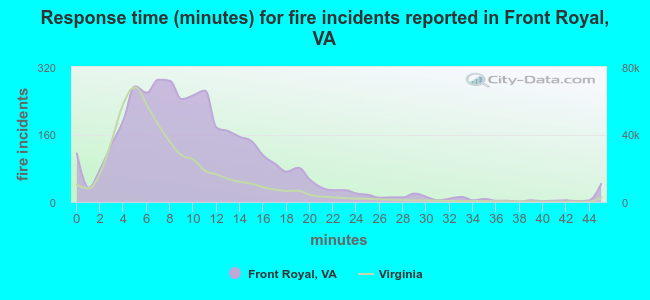 The median response time based on all reported fire incidents is 9 minutes. This is higher than the state median value.
The median response time in Front Royal, VA compared to nearest cities:
(Note: Based on data for all years, including only cities with at least 500 fire incidents)
| Front Royal: | 9 minutes |
| Strasburg: | 10 minutes |
| Stephens City: | 8 minutes |
| Washington: | 6 minutes |
| Winchester: | 6 minutes |
| Woodstock: | 9 minutes |
| Marshall: | 11 minutes |
| Berryville: | 11 minutes |
| Edinburg: | 12 minutes |
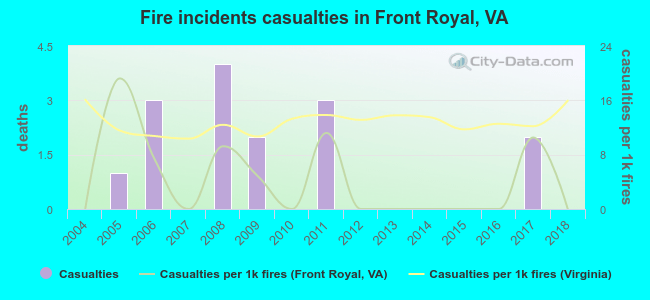 Based on the reports from the years 2004 - 2018 the average number of fire-related yearly casualties is 1. The highest number of reported injuries - 4 took place in 2008, and the lowest - 0 in 2004. The data has a constant trend.
The average number of casualties per 1,000 fire incidents is 4. This indicator was the highest - 19 in 2005, and the lowest 0 in 2004. The trend for casualties per 1,000 fire incidents is constant. Compared to the state value the number of injuries per 1,000 incidents is much lower.
Based on the reports from the years 2004 - 2018 the average number of fire-related yearly casualties is 1. The highest number of reported injuries - 4 took place in 2008, and the lowest - 0 in 2004. The data has a constant trend.
The average number of casualties per 1,000 fire incidents is 4. This indicator was the highest - 19 in 2005, and the lowest 0 in 2004. The trend for casualties per 1,000 fire incidents is constant. Compared to the state value the number of injuries per 1,000 incidents is much lower.Casualties per 1,000 incidents in Front Royal, VA compared to nearest cities:
(Note: Based on data for all years, including only cities with at least 500 fire incidents)
| Front Royal: | 4.0 |
| Strasburg: | 1.4 |
| Stephens City: | 4.0 |
| Washington: | 0.8 |
| Winchester: | 8.2 |
| Woodstock: | 9.1 |
| Marshall: | 1.5 |
| Berryville: | 1.3 |
| Edinburg: | 1.7 |
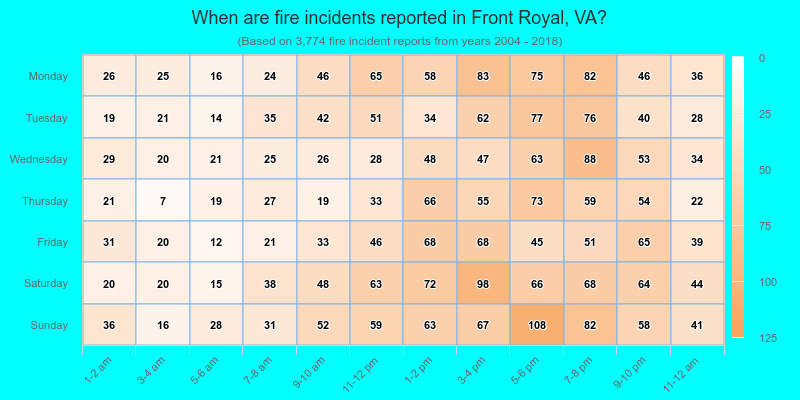
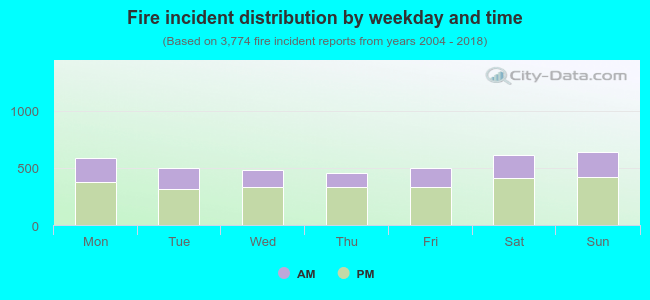 33.1% incidents where reported in the morning and 66.9% in the evening. The most fires (17.0%) took place on Sunday, and the least (12.1%) on Thursday.
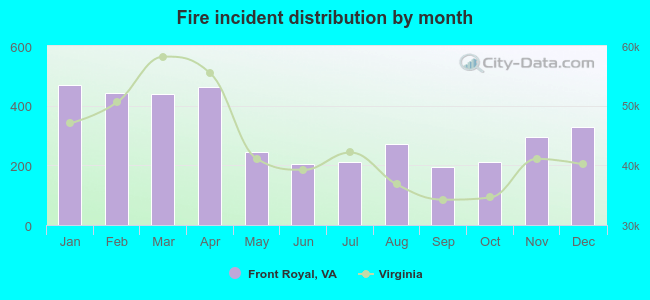 Based on the 3,774 incident reports from years 2004 - 2018 most fires (12.4%) took place during January, and the least (5.1%) in September.
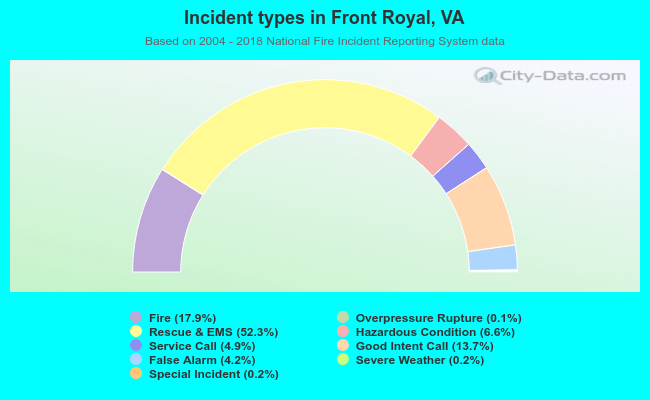 Out of all 21,070 cases reported during the years 2004 - 2018, the most belonged to the categories: Rescue & EMS (52.3%), Fire (17.9%), and Good Intent Call (13.7%).
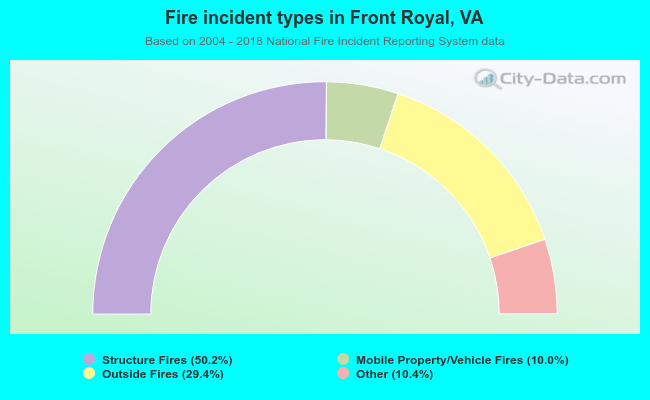 When looking into fire subcategories, the most reports belonged to: Structure Fires (50.2%), and Outside Fires (29.4%).