Winchester: Fire Incidents, Virginia (VA)
Where are fire incidents reported in Winchester, VA
Something went wrong! Please refresh the page.
| Fire incidents reported | |
|---|---|
| Sreet name | Count |
| **COUNTY STREET** | 1,044 |
| PLEASANT VALLEY RD | 280 |
| VALLEY AVE | 270 |
| LOUDOUN ST | 238 |
| BERRYVILLE AVE | 210 |
| AMHERST ST | 178 |
| SHAWNEE DR | 176 |
| I81 | 166 |
| FRONT ROYAL PIKE | 156 |
| CAMERON ST | 134 |
| COUNTY STREET | 134 |
| KENT ST | 114 |
| BACK MOUNTAIN RD | 104 |
| CORK ST | 102 |
| BRADDOCK ST | 94 |
| MARTINSBURG PIKE | 92 |
| BERRYVILLE PIKE | 86 |
| FORT COLLIER RD | 86 |
| MILLWOOD PIKE | 86 |
| MILLWOOD AVE | 82 |
| PICCADILLY ST | 80 |
| ROUND HILL RD | 74 |
| INTERSTATE 81 | 72 |
| JUBAL EARLY DR | 72 |
| INDIAN HOLLOW RD | 66 |
| WARDENSVILLE GR | 62 |
| MARTINSBURG PK | 60 |
| PAPERMILL RD | 60 |
| SENSENY RD | 60 |
| BERRYVILLE PK | 58 |
| Other | 2,333 |
2002 - 2018 National Fire Incident Reporting System (NFIRS) incidents
- Incident types reported to NFIRS in Winchester, VA
- 38,67565.1%Rescue & EMS
- 6,82911.5%Fire
- 5,2118.8%Hazardous Condition
- 3,0245.1%Service Call
- 2,6374.4%Good Intent Call
- 2,5544.3%False Alarm
- 3090.5%Special Incident
- 1420.2%Severe Weather
- Fire incident types reported to NFIRS in Winchester, VA
- 2,79240.9%Structure Fires
- 2,58337.8%Outside Fires
- 91013.3%Mobile Property/Vehicle Fires
- 5448.0%Other
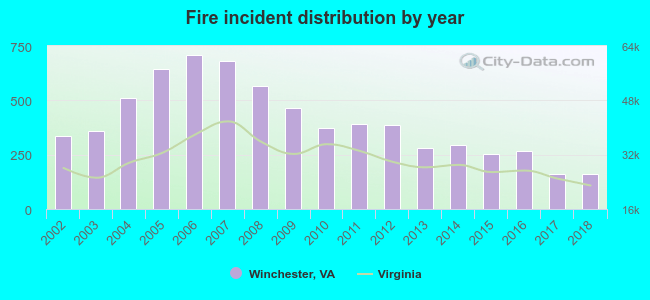 Based on the data from the years 2002 - 2018 the average number of fire incidents per year is 402. The highest number of fires - 710 took place in 2006, and the least - 159 in 2018. The data has a decreasing trend.
The average number of yearly fire incidents per 10k residents in Winchester, VA compared to nearest cities:
(Note: Based on data for the last 3 years, including only cities with population 5,000 and above)
| Winchester: | 71.2 |
| Strasburg: | 42.2 |
| Front Royal: | 108.4 |
| Purcellville: | 67.2 |
| Woodstock: | 77.8 |
| Leesburg: | 16.7 |
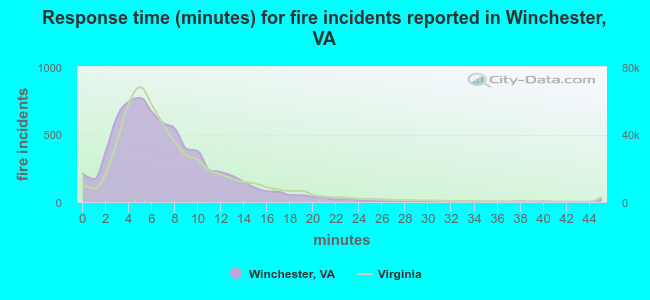 The median response time based on all reported fire incidents is 6 minutes. This is about the same as the Virginia median value.
The median response time in Winchester, VA compared to nearest cities:
(Note: Based on data for all years, including only cities with at least 500 fire incidents)
| Winchester: | 6 minutes |
| Stephens City: | 8 minutes |
| Berryville: | 11 minutes |
| Strasburg: | 10 minutes |
| Front Royal: | 9 minutes |
| Purcellville: | 9 minutes |
| Marshall: | 11 minutes |
| Woodstock: | 9 minutes |
| Sharpsburg: | 9 minutes |
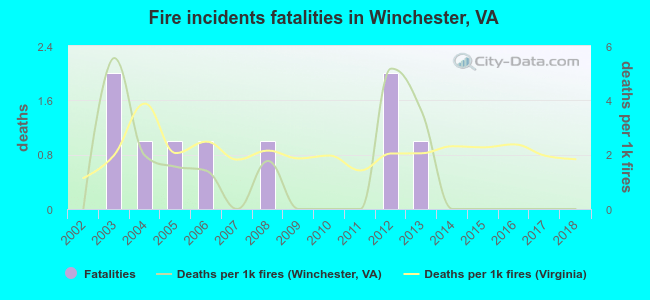 Based on the reports from the years 2002 - 2018 the average number of fire-related fatalities per year is 1. The highest number of reported deaths - 2 took place in 2003, and the lowest - 0 in 2002. The data has a constant trend.
The average number of deaths per 1,000 fires is 1. This indicator was the highest - 6 in 2003, and the lowest 0 in 2002. The trend for deaths per 1,000 fire incidents is constant. Compared to the Virginia value the number of fatalities per 1,000 fires is lower.
Based on the reports from the years 2002 - 2018 the average number of fire-related fatalities per year is 1. The highest number of reported deaths - 2 took place in 2003, and the lowest - 0 in 2002. The data has a constant trend.
The average number of deaths per 1,000 fires is 1. This indicator was the highest - 6 in 2003, and the lowest 0 in 2002. The trend for deaths per 1,000 fire incidents is constant. Compared to the Virginia value the number of fatalities per 1,000 fires is lower.Deaths per 1,000 incidents in Winchester, VA compared to nearest cities:
(Note: Based on data for all years, including only cities with at least 2,500 fire incidents)
| Winchester: | 1.3 |
| Front Royal: | 1.1 |
| Leesburg: | 0.4 |
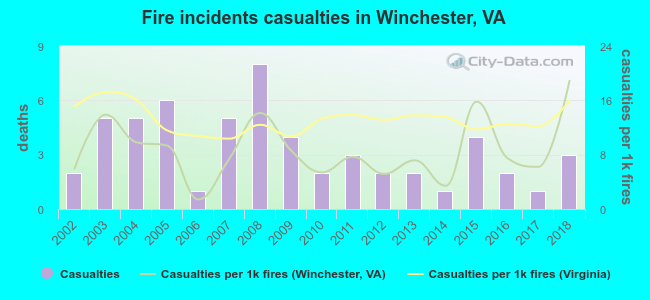 Based on the reports from the years 2002 - 2018 the average number of fire-related yearly casualties is 3. The highest number of reported injuries - 8 took place in 2008, and the lowest - 1 in 2006. The data has an increasing trend.
The average number of casualties per 1,000 fires is 9. This indicator was the highest - 19 in 2018, and the lowest 1 in 2006. The trend for casualties per 1,000 fire incidents is increasing. Compared to the Virginia value the number of casualties per 1,000 incidents is lower.
Based on the reports from the years 2002 - 2018 the average number of fire-related yearly casualties is 3. The highest number of reported injuries - 8 took place in 2008, and the lowest - 1 in 2006. The data has an increasing trend.
The average number of casualties per 1,000 fires is 9. This indicator was the highest - 19 in 2018, and the lowest 1 in 2006. The trend for casualties per 1,000 fire incidents is increasing. Compared to the Virginia value the number of casualties per 1,000 incidents is lower.Casualties per 1,000 incidents in Winchester, VA compared to nearest cities:
(Note: Based on data for all years, including only cities with at least 500 fire incidents)
| Winchester: | 8.2 |
| Stephens City: | 4.0 |
| Berryville: | 1.3 |
| Strasburg: | 1.4 |
| Front Royal: | 4.0 |
| Purcellville: | 0.9 |
| Marshall: | 1.5 |
| Woodstock: | 9.1 |
| Sharpsburg: | 3.0 |
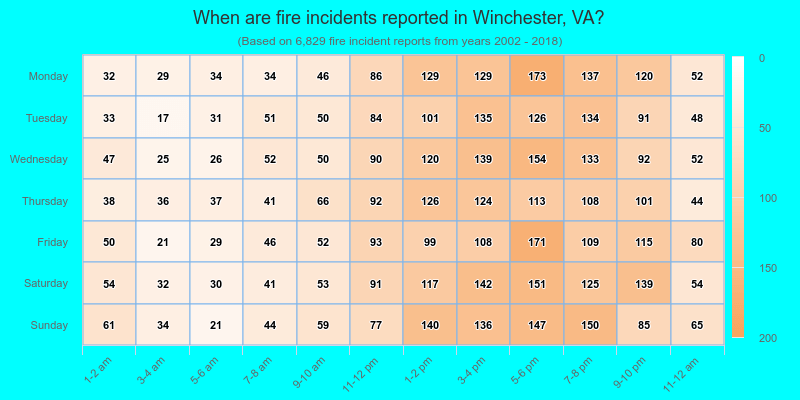
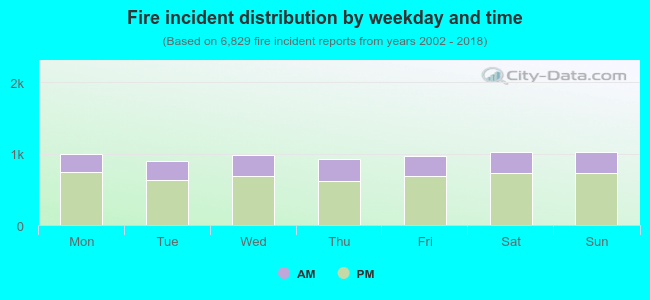 29.5% incidents where reported in the morning and 70.5% in the evening. The most fires (15.1%) took place on Saturday, and the least (13.2%) on Tuesday.
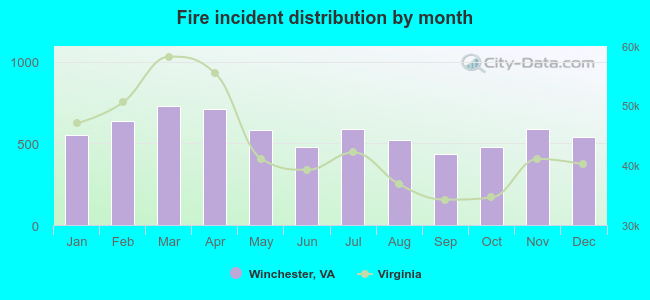 According to the 6,829 reports from years 2002 - 2018 most fires (10.7%) took place during March, and the least (6.3%) in September.
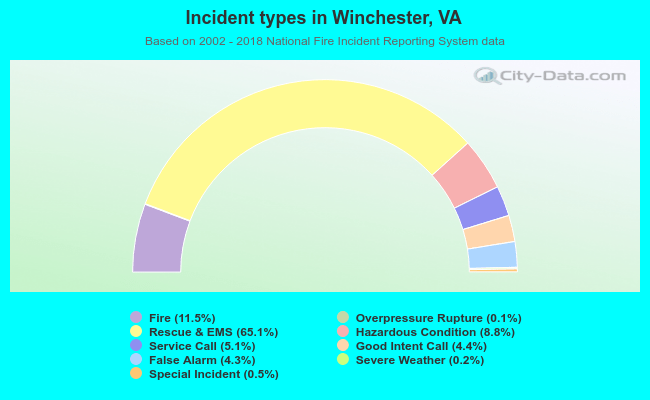 Out of all 59,425 cases reported during the years 2002 - 2018, the most belonged to the categories: Rescue & EMS (65.1%), Fire (11.5%), and Hazardous Condition (8.8%).
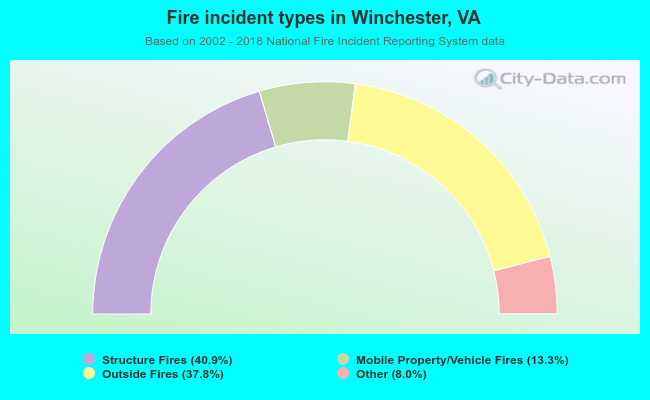 When looking into fire subcategories, the most reports belonged to: Structure Fires (40.9%), and Outside Fires (37.8%).