Gallatin: Fire Incidents, Tennessee (TN)
Where are fire incidents reported in Gallatin, TN
Something went wrong! Please refresh the page.
| Fire incidents reported | |
|---|---|
| Sreet name | Count |
| NASHVILLE PIKE | 224 |
| WATER AVE | 202 |
| MAIN ST | 122 |
| AIRPORT RD | 108 |
| LONG HOLLOW PIKE | 88 |
| HARTSVILLE PIKE | 70 |
| FRANKLIN ST | 66 |
| DOBBINS PIKE | 62 |
| STEAM PLANT RD | 52 |
| GREEN WAVE DR | 46 |
| RED RIVER RD | 46 |
| HANCOCK ST | 42 |
| MAPLE ST | 42 |
| BELVEDERE DR | 40 |
| 109 HWY | 38 |
| DOBBINS PIKE | 38 |
| DOUGLAS BEND RD | 38 |
| EASTLAND AVE | 38 |
| WOODS FERRY RD | 36 |
| HOLLYWOOD BLVD | 32 |
| CAGES BEND RD | 30 |
| LIBERTY LN | 28 |
| NEALS LN | 28 |
| VILLAGE GREEN XING | 26 |
| BROADWAY | 24 |
| CAIRO RD | 24 |
| HWY 25 | 24 |
| LOCK 4 RD | 24 |
| PACE ST | 24 |
| WINCHESTER ST | 24 |
| Other | 713 |
2002 - 2018 National Fire Incident Reporting System (NFIRS) incidents
- Incident types reported to NFIRS in Gallatin, TN
- 14,29761.1%Rescue & EMS
- 2,39910.2%Fire
- 2,2669.7%Hazardous Condition
- 1,7357.4%False Alarm
- 1,4266.1%Good Intent Call
- 1,1695.0%Service Call
- 670.3%Overpressure Rupture
- 380.2%Special Incident
- Fire incident types reported to NFIRS in Gallatin, TN
- 96540.2%Structure Fires
- 88436.8%Outside Fires
- 45418.9%Mobile Property/Vehicle Fires
- 964.0%Other
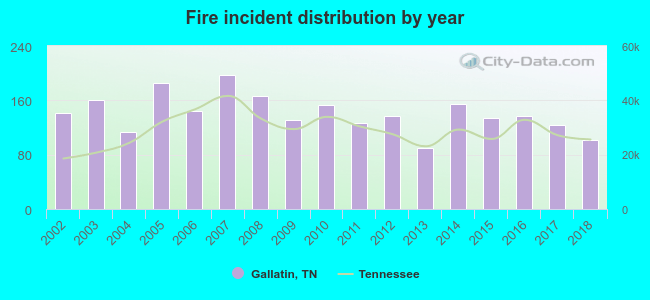 According to the data from the years 2002 - 2018 the average number of fire incidents per year is 141. The highest number of fire incidents - 197 took place in 2007, and the least - 90 in 2013. The data has a dropping trend.
The average number of yearly fire incidents per 10k residents in Gallatin, TN compared to nearest cities:
(Note: Based on data for the last 3 years, including only cities with population 5,000 and above)
| Gallatin: | 36.3 |
| Castalian Springs: | 25.4 |
| Hendersonville: | 16.0 |
| Mount Juliet: | 23.0 |
| White House: | 48.0 |
| Lebanon: | 91.1 |
| Portland: | 62.7 |
| Goodlettsville: | 52.6 |
| Millersville: | 28.0 |
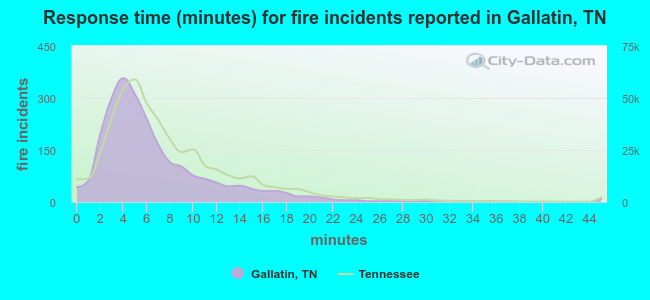 The median response time based on all reported fire incidents is 5 minutes. This is lower compared to the state median value.
The median response time in Gallatin, TN compared to nearest cities:
(Note: Based on data for all years, including only cities with at least 500 fire incidents)
| Gallatin: | 5 minutes |
| Hendersonville: | 5 minutes |
| Mount Juliet: | 9 minutes |
| White House: | 6 minutes |
| Lebanon: | 7 minutes |
| Portland: | 9 minutes |
| Goodlettsville: | 4 minutes |
| Westmoreland: | 11 minutes |
| Greenbrier: | 8 minutes |
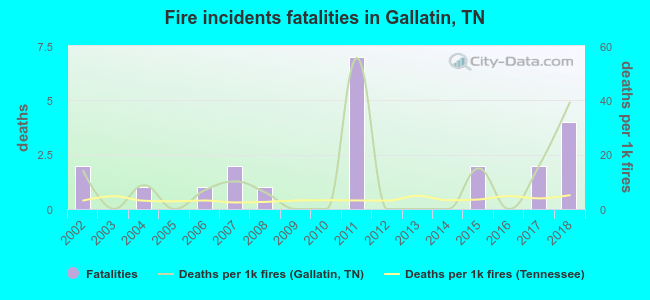 Based on the data from the years 2002 - 2018 the average number of fire-related yearly deaths is 1. The highest number of reported deaths - 7 took place in 2011, and the lowest - 0 in 2003. The data has an increasing trend.
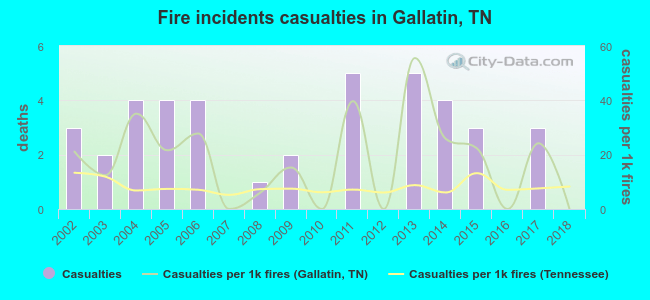 According to the reports from the years 2002 - 2018 the average number of fire-related casualties per year is 2. The highest number of reported injuries - 5 took place in 2011, and the lowest - 0 in 2007. The data has a declining trend.
The average number of injuries per 1,000 fires is 18. This indicator was the highest - 56 in 2013, and the lowest 0 in 2007. The trend for injuries per 1,000 incidents is decreasing. Compared to the state value the number of casualties per 1,000 fire incidents is much higher.
According to the reports from the years 2002 - 2018 the average number of fire-related casualties per year is 2. The highest number of reported injuries - 5 took place in 2011, and the lowest - 0 in 2007. The data has a declining trend.
The average number of injuries per 1,000 fires is 18. This indicator was the highest - 56 in 2013, and the lowest 0 in 2007. The trend for injuries per 1,000 incidents is decreasing. Compared to the state value the number of casualties per 1,000 fire incidents is much higher.Casualties per 1,000 incidents in Gallatin, TN compared to nearest cities:
(Note: Based on data for all years, including only cities with at least 500 fire incidents)
| Gallatin: | 16.7 |
| Hendersonville: | 30.0 |
| Mount Juliet: | 12.6 |
| White House: | 2.4 |
| Lebanon: | 4.6 |
| Portland: | 0.6 |
| Goodlettsville: | 7.5 |
| Westmoreland: | 0.0 |
| Greenbrier: | 9.7 |
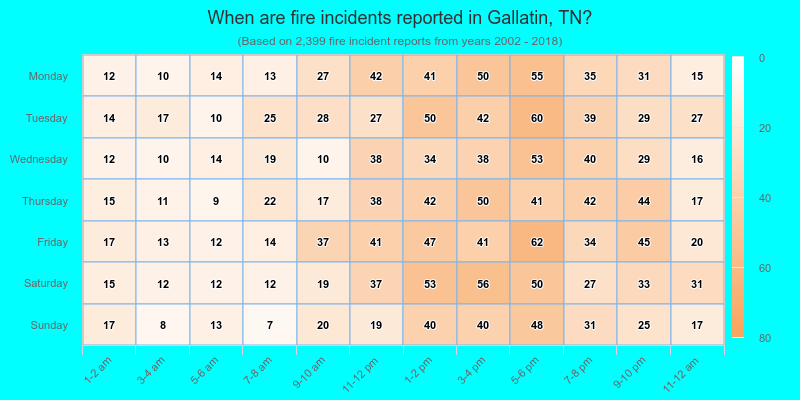
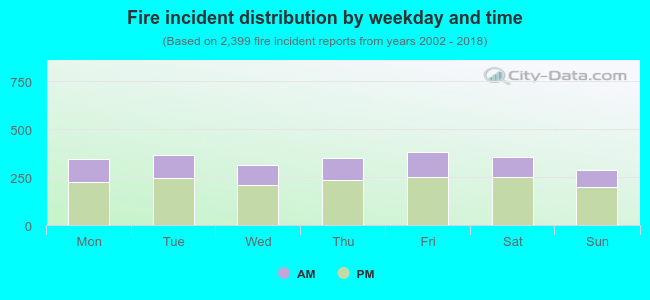 32.5% incidents where reported in the morning and 67.5% in the evening. The most fires (16.0%) took place on Friday, and the least (11.9%) on Sunday.
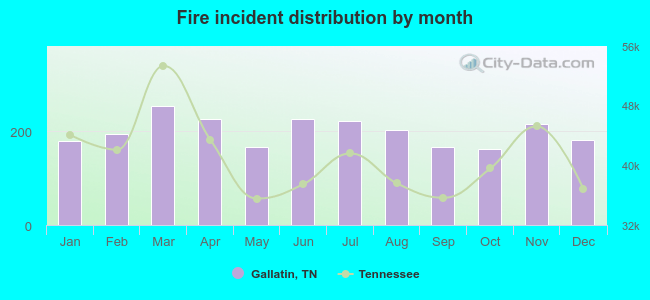 According to the 2,399 reports from years 2002 - 2018 most fires (10.6%) took place during March, and the least (6.8%) in October.
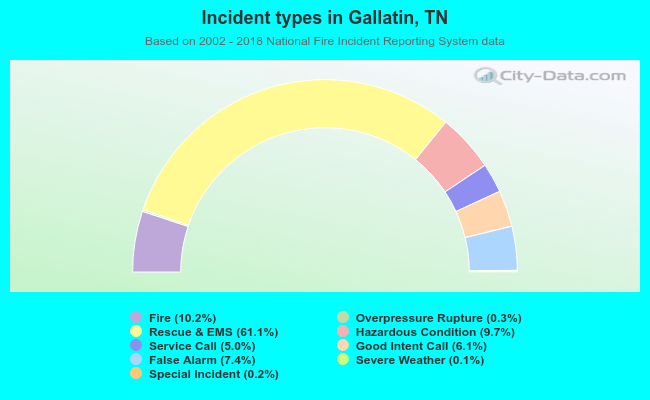 Out of all 23,415 cases reported during the years 2002 - 2018, the most belonged to the categories: Rescue & EMS (61.1%), Fire (10.2%), and Hazardous Condition (9.7%).
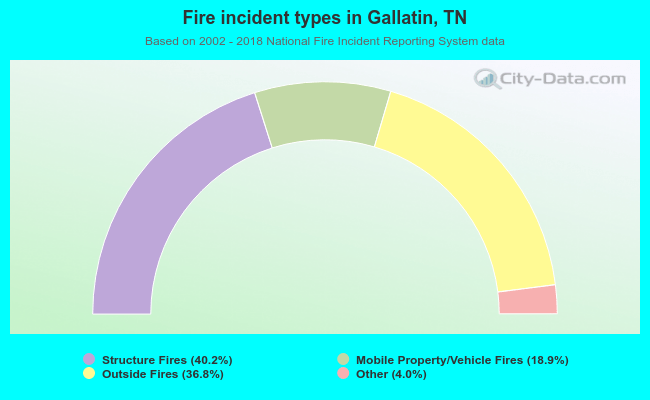 When looking into fire subcategories, the most reports belonged to: Structure Fires (40.2%), and Outside Fires (36.8%).