Millersville: Fire Incidents, Tennessee (TN)
Where are fire incidents reported in Millersville, TN
Something went wrong! Please refresh the page.
|
| |||||||||||||||||||||||||||||||||||||||||||||||||||||||||||||||||||||||||||||||||||||||||||||||||||||||||||||
2002 - 2018 National Fire Incident Reporting System (NFIRS) incidents
- Incident types reported to NFIRS in Millersville, TN
- 1,96058.3%Rescue & EMS
- 44413.2%Fire
- 3309.8%Service Call
- 2296.8%Good Intent Call
- 1875.6%Hazardous Condition
- 1644.9%False Alarm
- 260.8%Severe Weather
- 230.7%Special Incident
- Fire incident types reported to NFIRS in Millersville, TN
- 19844.6%Outside Fires
- 12027.0%Structure Fires
- 8819.8%Mobile Property/Vehicle Fires
- 388.6%Other
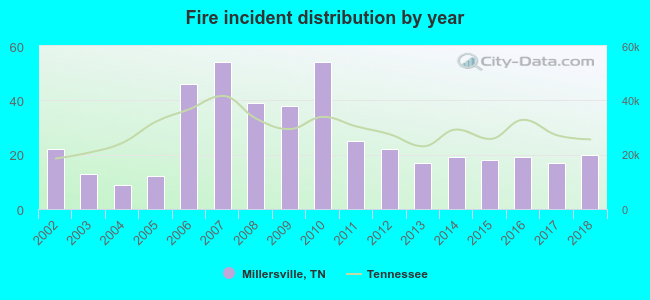 Based on the data from the years 2002 - 2018 the average number of fire incidents per year is 26. The highest number of fire incidents - 54 took place in 2007, and the least - 9 in 2004. The data has a decreasing trend.
The average number of yearly fire incidents per 10k residents in Millersville, TN compared to nearest cities:
(Note: Based on data for the last 3 years, including only cities with population 5,000 and above)
| Millersville: | 28.0 |
| Goodlettsville: | 52.6 |
| Greenbrier: | 112.2 |
| White House: | 48.0 |
| Hendersonville: | 16.0 |
| Springfield: | 74.2 |
| Gallatin: | 36.3 |
| Portland: | 62.7 |
| Mount Juliet: | 23.0 |
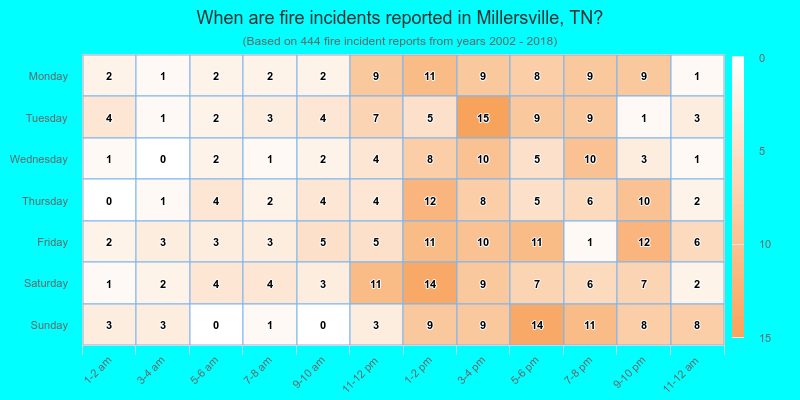
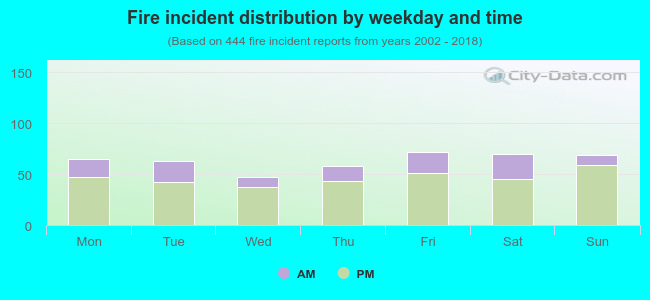 27.0% incidents where reported in the morning and 73.0% in the evening. The most fires (16.2%) took place on Friday, and the least (10.6%) on Wednesday.
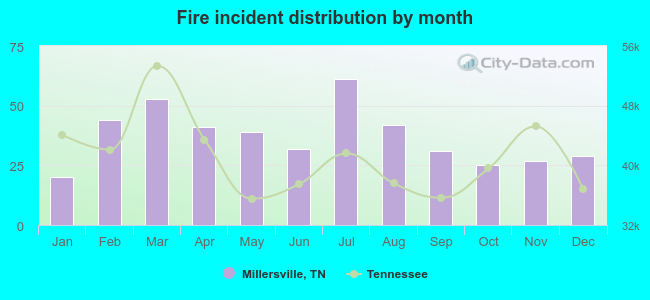 According to the 444 fires from years 2002 - 2018 most fires (13.7%) took place during July, and the least (4.5%) in January.
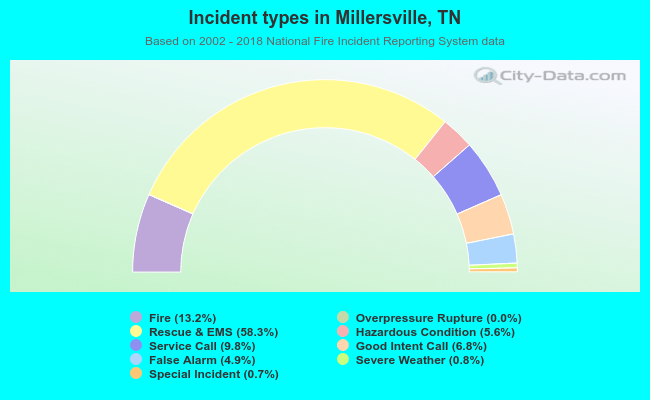 Out of all 3,364 cases reported during the years 2002 - 2018, the most belonged to the categories: Rescue & EMS (58.3%), Fire (13.2%), and Service Call (9.8%).
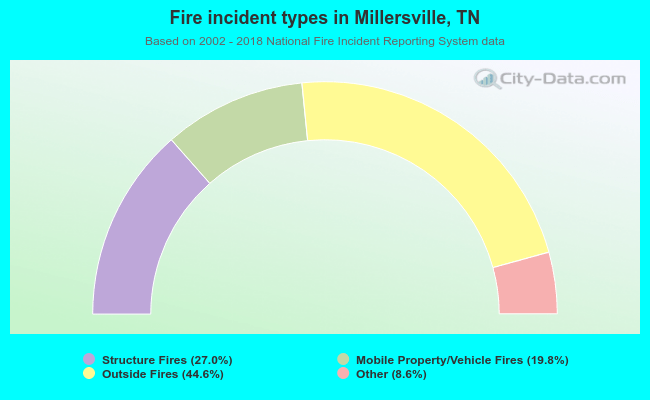 When looking into fire subcategories, the most reports belonged to: Outside Fires (44.6%), and Structure Fires (27.0%).