Garden City: Fire Incidents, Kansas (KS)
Where are fire incidents reported in Garden City, KS
Something went wrong! Please refresh the page.
| Fire incidents reported | |
|---|---|
| Sreet name | Count |
| HWY 50 | 292 |
| KANSAS AVE | 158 |
| HWY 83 | 128 |
| MAIN | 84 |
| JENNIE BARKER RD | 82 |
| 8TH | 80 |
| CAMPUS DR | 80 |
| FARMLAND RD | 80 |
| JONES AVE | 78 |
| MARY | 78 |
| MAPLE | 70 |
| TAYLOR AVE | 70 |
| FULTON | 66 |
| BURNSIDE DR | 62 |
| HWY 156 | 54 |
| SAGEBRUSH RD | 54 |
| 3RD | 48 |
| 7TH | 48 |
| FLEMING | 48 |
| 9TH | 42 |
| 4TH | 40 |
| 6TH | 40 |
| RAILROAD AVE | 38 |
| SCHULMAN AVE | 36 |
| MAIN ST | 34 |
| 11TH | 32 |
| CAMPBELL | 32 |
| LABRADOR BLVD | 32 |
| SPRUCE | 32 |
| A ST | 30 |
| Other | 508 |
2002 - 2018 National Fire Incident Reporting System (NFIRS) incidents
- Incident types reported to NFIRS in Garden City, KS
- 2,55636.3%Fire
- 1,86026.4%Hazardous Condition
- 1,01214.4%Rescue & EMS
- 79011.2%False Alarm
- 6228.8%Good Intent Call
- 1742.5%Service Call
- 250.4%Overpressure Rupture
- 80.1%Special Incident
- Fire incident types reported to NFIRS in Garden City, KS
- 1,47257.6%Outside Fires
- 65125.5%Structure Fires
- 38315.0%Mobile Property/Vehicle Fires
- 502.0%Other
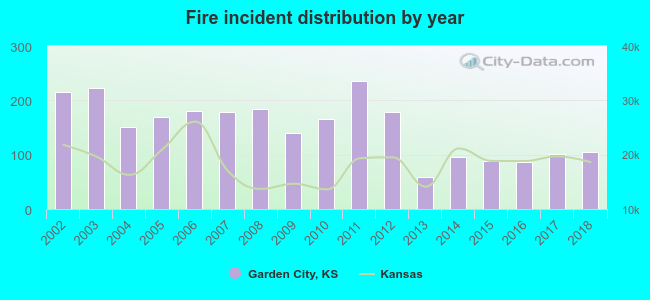 According to the data from the years 2002 - 2018 the average number of fires per year is 150. The highest number of reported fire incidents - 235 took place in 2011, and the least - 59 in 2013. The data has a dropping trend.
The average number of yearly fire incidents per 10k residents in Garden City, KS compared to nearest cities:
(Note: Based on data for the last 3 years, including only cities with population 5,000 and above)
| Garden City: | 36.0 |
| Ulysses: | 26.0 |
| Dodge City: | 82.7 |
| Liberal: | 66.2 |
 The median response time based on all reported fire incidents is 6 minutes. This is about the same as the state median value.
The median response time in Garden City, KS compared to nearest cities:
(Note: Based on data for all years, including only cities with at least 500 fire incidents)
| Garden City: | 6 minutes |
| Dodge City: | 5 minutes |
| Hugoton: | 13 minutes |
| Liberal: | 5 minutes |
| Ashland: | 13 minutes |
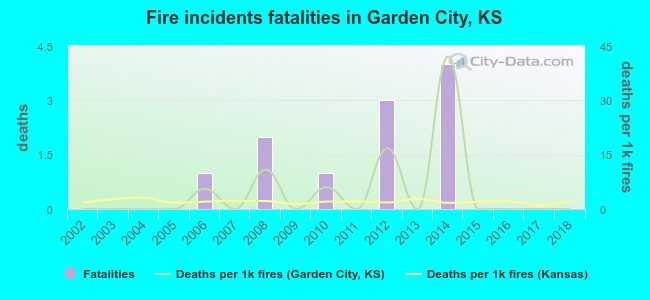 Based on the data from the years 2002 - 2018 the average number of fire-related yearly deaths is 1. The highest number of deaths - 4 took place in 2014, and the lowest - 0 in 2002. The data has a constant trend.
The average number of deaths per 1,000 fires is 5. This indicator was the highest - 42 in 2014, and the lowest 0 in 2002. The trend for fatalities per 1,000 fire incidents is constant. Compared to the Kansas value the number of fatalities per 1,000 fires is much higher.
Based on the data from the years 2002 - 2018 the average number of fire-related yearly deaths is 1. The highest number of deaths - 4 took place in 2014, and the lowest - 0 in 2002. The data has a constant trend.
The average number of deaths per 1,000 fires is 5. This indicator was the highest - 42 in 2014, and the lowest 0 in 2002. The trend for fatalities per 1,000 fire incidents is constant. Compared to the Kansas value the number of fatalities per 1,000 fires is much higher.Deaths per 1,000 incidents in Garden City, KS compared to nearest cities:
(Note: Based on data for all years, including only cities with at least 2,500 fire incidents)
| Garden City: | 4.3 |
| Dodge City: | 3.0 |
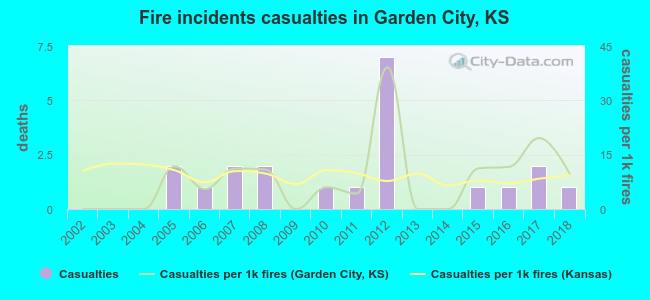 According to the data from the years 2002 - 2018 the average number of fire-related yearly casualties is 1. The highest number of reported injuries - 7 took place in 2012, and the lowest - 0 in 2002. The data has a rising trend.
The average number of casualties per 1,000 fires is 8. This indicator was the highest - 39 in 2012, and the lowest 0 in 2002. The trend for casualties per 1,000 incidents is rising. Compared to the Kansas value the number of injuries per 1,000 fires is about the same.
According to the data from the years 2002 - 2018 the average number of fire-related yearly casualties is 1. The highest number of reported injuries - 7 took place in 2012, and the lowest - 0 in 2002. The data has a rising trend.
The average number of casualties per 1,000 fires is 8. This indicator was the highest - 39 in 2012, and the lowest 0 in 2002. The trend for casualties per 1,000 incidents is rising. Compared to the Kansas value the number of injuries per 1,000 fires is about the same.Casualties per 1,000 incidents in Garden City, KS compared to nearest cities:
(Note: Based on data for all years, including only cities with at least 500 fire incidents)
| Garden City: | 8.2 |
| Dodge City: | 6.0 |
| Hugoton: | 0.0 |
| Liberal: | 25.4 |
| Ashland: | 0.0 |
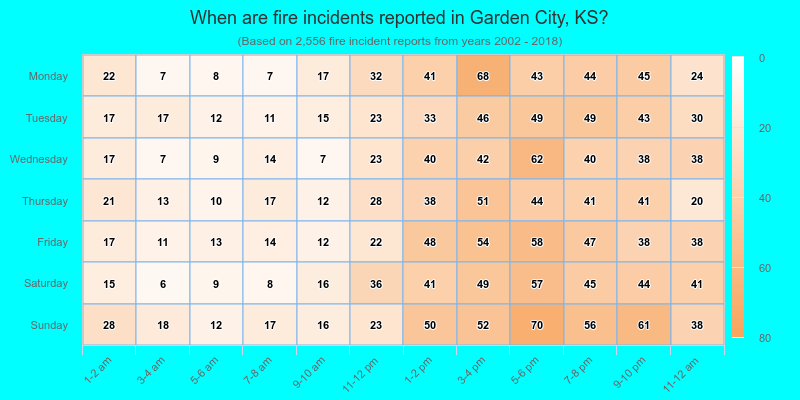
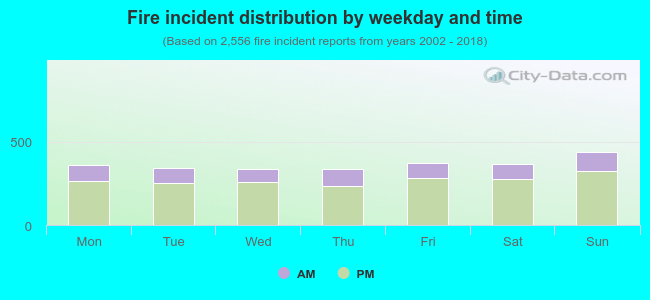 25.8% incidents where reported in the morning and 74.2% in the evening. The most fires (17.3%) took place on Sunday, and the least (13.1%) on Thursday.
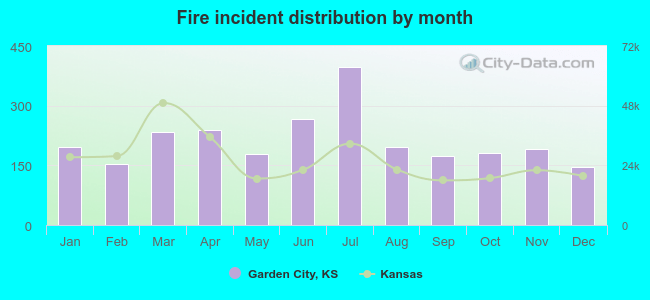 Based on the 2,556 fire incident reports from years 2002 - 2018 most fires (15.5%) took place during July, and the least (5.7%) in December.
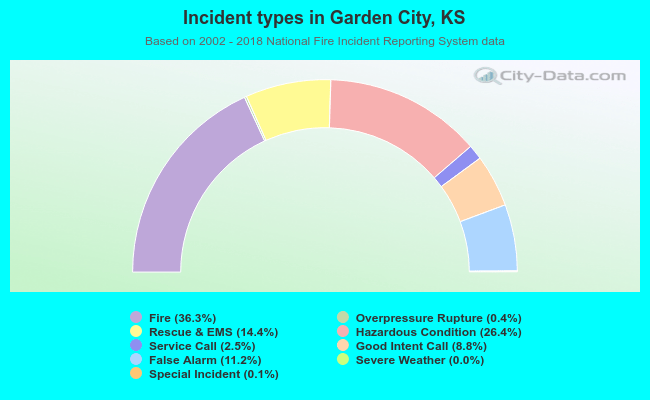 Out of all 7,048 cases reported during the years 2002 - 2018, the most belonged to the categories: Fire (36.3%), Hazardous Condition (26.4%), and Rescue & EMS (14.4%).
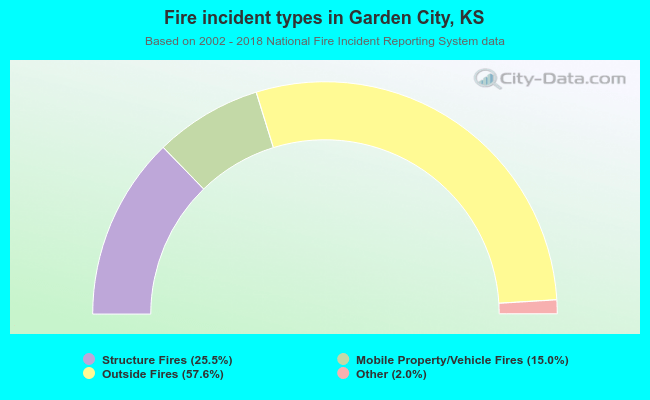 When looking into fire subcategories, the most reports belonged to: Outside Fires (57.6%), and Structure Fires (25.5%).