Liberal: Fire Incidents, Kansas (KS)
Where are fire incidents reported in Liberal, KS
Something went wrong! Please refresh the page.
| Fire incidents reported | |
|---|---|
| Sreet name | Count |
| KANSAS AVE | 160 |
| WESTERN AVE | 158 |
| ROOSEVELT AVE | 142 |
| NEW YORK AVE | 132 |
| PANCAKE BLVD | 120 |
| CAIN AVE | 114 |
| PERSHING AVE | 106 |
| GRANT AVE | 86 |
| CALHOUN AVE | 84 |
| 8TH ST | 82 |
| CLAY AVE | 80 |
| PINE ST | 74 |
| WASHINGTON AVE | 74 |
| 2ND ST | 72 |
| COUNTRY ESTATES RD | 54 |
| VIRGINIA AVE | 54 |
| PENNSYLVANIA AVE | 52 |
| SHERMAN AVE | 50 |
| HWY 54 | 48 |
| CARLTON AVE | 44 |
| LINCOLN AVE | 44 |
| BLUEBELL RD | 42 |
| CURTIS ST | 40 |
| PROSPECT AVE | 40 |
| TUCKER RD | 36 |
| HWY 83 | 34 |
| PURDUE AVE | 34 |
| ARLINGTON DR | 32 |
| HOLLY DR | 32 |
| OKLAHOMA AVE | 32 |
| Other | 213 |
2002 - 2018 National Fire Incident Reporting System (NFIRS) incidents
- Incident types reported to NFIRS in Liberal, KS
- 6,40452.3%Rescue & EMS
- 2,36519.3%Fire
- 1,72614.1%Hazardous Condition
- 7956.5%Good Intent Call
- 4904.0%Service Call
- 4213.4%False Alarm
- 220.2%Overpressure Rupture
- Fire incident types reported to NFIRS in Liberal, KS
- 1,22851.9%Outside Fires
- 75031.7%Structure Fires
- 36115.3%Mobile Property/Vehicle Fires
- 261.1%Other
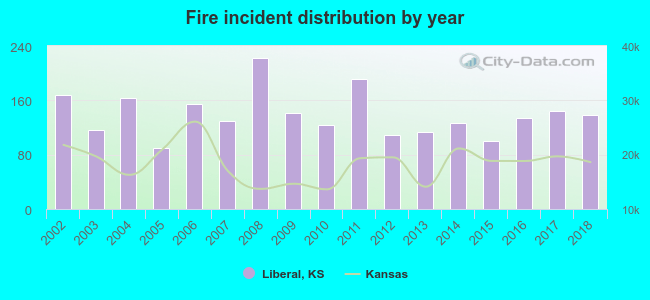 According to the data from the years 2002 - 2018 the average number of fires per year is 139. The highest number of fires - 222 took place in 2008, and the least - 90 in 2005. The data has a declining trend.
The average number of yearly fire incidents per 10k residents in Liberal, KS compared to nearest cities:
(Note: Based on data for the last 3 years, including only cities with population 5,000 and above)
| Liberal: | 66.2 |
| Ulysses: | 26.0 |
| Garden City: | 36.0 |
| Dodge City: | 82.7 |
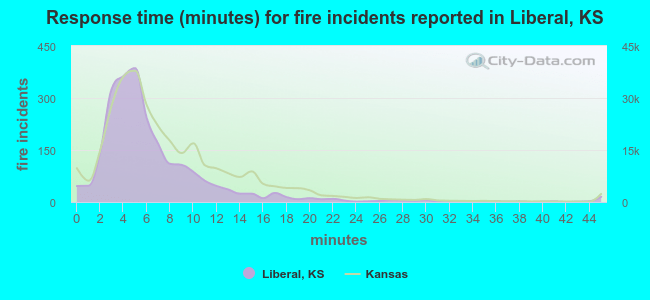 The median response time based on all reported fire incidents is 5 minutes. This is lower compared to the Kansas median value.
The median response time in Liberal, KS compared to nearest cities:
(Note: Based on data for all years, including only cities with at least 500 fire incidents)
| Liberal: | 5 minutes |
| Hugoton: | 13 minutes |
| Garden City: | 6 minutes |
| Ashland: | 13 minutes |
| Dodge City: | 5 minutes |
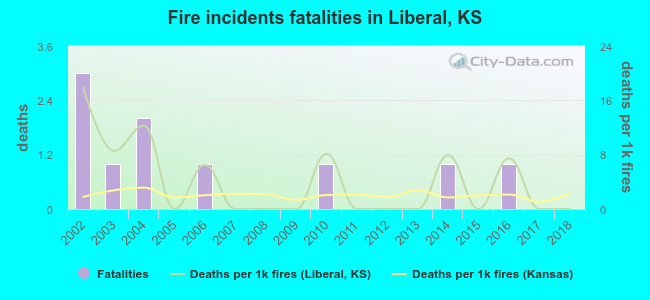 Based on the reports from the years 2002 - 2018 the average number of fire-related fatalities per year is 1. The highest number of reported deaths - 3 took place in 2002, and the lowest - 0 in 2005. The data has a decreasing trend.
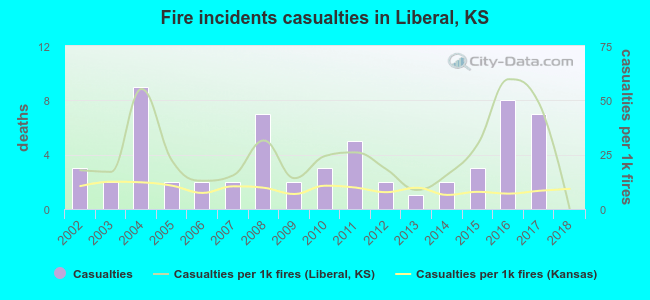 According to the reports from the years 2002 - 2018 the average number of fire-related casualties per year is 4. The highest number of reported injuries - 9 took place in 2004, and the lowest - 0 in 2018. The data has a declining trend.
The average number of casualties per 1,000 fires is 25. This indicator was the highest - 60 in 2016, and the lowest 0 in 2018. The trend for injuries per 1,000 fire incidents is dropping. Compared to the state value the number of casualties per 1,000 fire incidents is much higher.
According to the reports from the years 2002 - 2018 the average number of fire-related casualties per year is 4. The highest number of reported injuries - 9 took place in 2004, and the lowest - 0 in 2018. The data has a declining trend.
The average number of casualties per 1,000 fires is 25. This indicator was the highest - 60 in 2016, and the lowest 0 in 2018. The trend for injuries per 1,000 fire incidents is dropping. Compared to the state value the number of casualties per 1,000 fire incidents is much higher.Casualties per 1,000 incidents in Liberal, KS compared to nearest cities:
(Note: Based on data for all years, including only cities with at least 500 fire incidents)
| Liberal: | 25.4 |
| Hugoton: | 0.0 |
| Garden City: | 8.2 |
| Ashland: | 0.0 |
| Dodge City: | 6.0 |
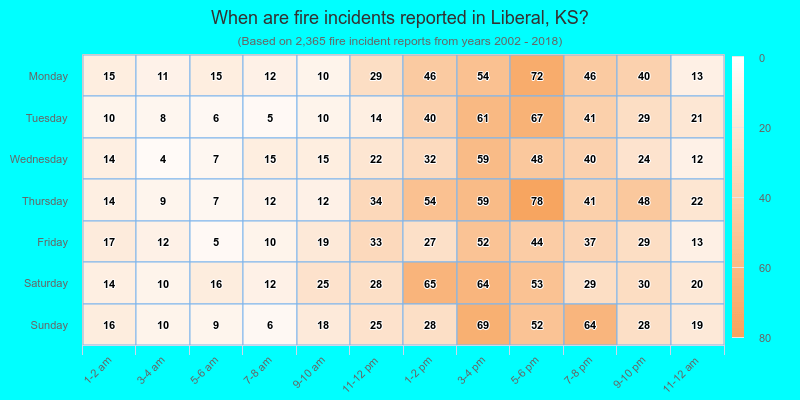
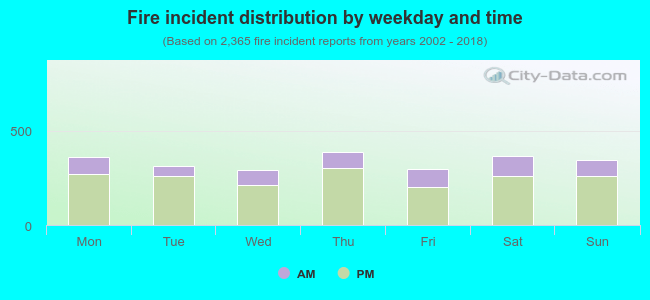 25.2% incidents where reported in the morning and 74.8% in the evening. The most fires (16.5%) took place on Thursday, and the least (12.3%) on Wednesday.
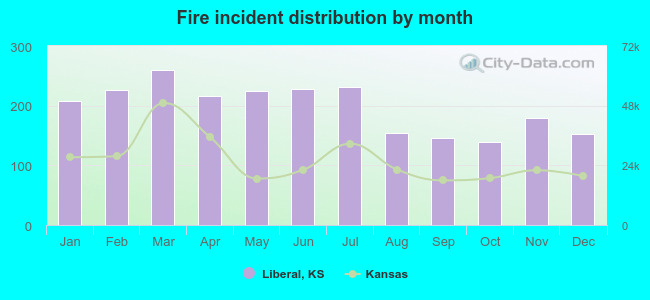 According to the 2,365 incident reports from years 2002 - 2018 most fires (11.0%) took place during March, and the least (5.9%) in October.
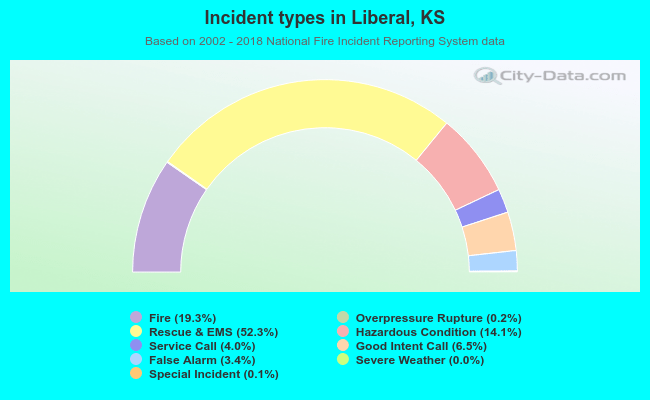 Out of all 12,238 cases reported during the years 2002 - 2018, the most belonged to the categories: Rescue & EMS (52.3%), Fire (19.3%), and Hazardous Condition (14.1%).
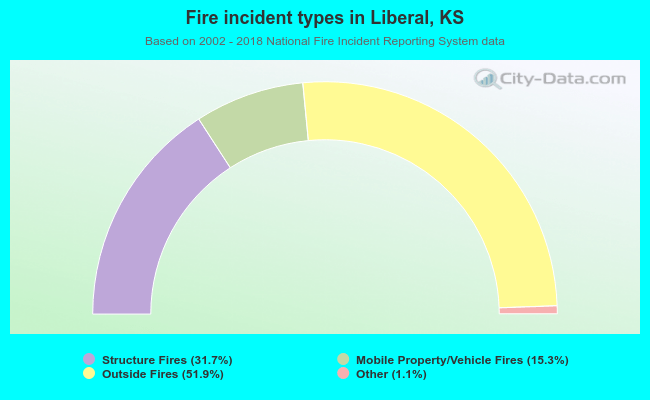 When looking into fire subcategories, the most incidents belonged to: Outside Fires (51.9%), and Structure Fires (31.7%).